The Conference Board publishes leading, coincident, and lagging indexes designed to signal peaks and troughs in the business cycle for major economies around the world.
The Conference Board Leading Economic Index® (LEI) for the US Rose for the Second Consecutive Month in May
Latest Press Release
Updated: Thursday, June 18, 2026
Using the Composite Indexes: The Leading Economic Index (LEI) provides an early indication of significant turning points in the business cycle and where the economy is heading in the near term. The Coincident Economic Index (CEI) provides an indication of the current state of the economy. Additional details are below.
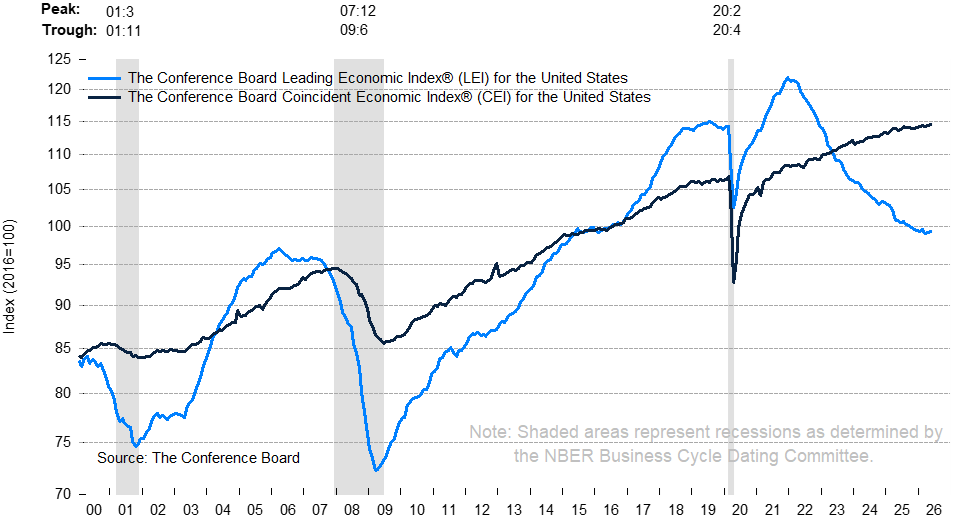
The Conference Board Leading Economic Index® (LEI) for the US increased slightly by 0.1% in May 2026 to 99.3 (2016=100), following a 0.2% increase in April. After these two consecutive increases, the LEI is down just 0.3% over the six months between November 2025 and May 2026, a much smaller rate of decline than its 1.3% contraction over the previous six months (May to November 2025).
“The Leading Index for the US increased slightly in May, fueled entirely by positive contributions from financial components, especially stock prices and the interest rate spread,” said Justyna Zabinska-La Monica, Senior Manager, Business Cycle Indicators, at The Conference Board. “On the non-financial side of the LEI, only ISM® New Orders Index showed some strength, with consumer expectations remaining a major drag. Despite two consecutive monthly increases, the LEI’s six- and twelve-month growth rates were still negative, suggesting slower economic expansion ahead. Consumers are feeling squeezed because everyday costs—especially gas and energy—are rising faster than their incomes, leaving many households with less money available for things like travel, restaurants, entertainment, and shopping. The good news is that businesses are spending heavily on AI, data centers, and new technology, helping to keep the economy growing, while consumers pull back spending. The overall job market is expected to stay fairly healthy in 2026, but economic growth will be weaker than in recent years. The Conference Board is currently projecting 1.8% y/y GDP growth in 2026, down from 2.1% in 2025.”
The Conference Board Coincident Economic Index® (CEI) for the US increased by 0.2% in May 2026 to 114.6 (2016=100), after a marginal increase of 0.1% in April. Overall, the CEI expanded by 0.6% over the six months between November 2025 and May 2026, an improvement from its growth of 0.2% over the previous six months. The CEI’s four component indicators—payroll employment, personal income less transfer payments, manufacturing and trade sales, and industrial production—are included among the data used to determine recessions in the US. All components of the CEI made positive contributions in May.
The Conference Board Lagging Economic Index® (LAG) for the US dipped by 0.1% to 120.5 (2016=100) in May 2026, after a 0.5% increase in April. However, the LAG’s six-month change was firmly in positive territory at 0.9% growth between November 2025 and May 2026, up from being flat over the previous six months (May to November 2025).
This month’s release of the composite economic indexes incorporates annual benchmark revisions which bring them up-to-date with revisions in the source data. These revisions do not change the cyclical properties of the indexes. The indexes are updated throughout the year, but only for the previous six months. Data revisions that fall outside of the moving six-month window are not incorporated until the benchmark revision is made and the entire histories of the indexes are recomputed. As a result, the revised indexes, in levels and month-on-month changes, will not be directly comparable to those issued prior to the benchmark revision.
For more information, please visit conference-board.org/topics/business-cycle-indicators/ or contact us at indicators@tcb.org.
The US LEI rose a second consecutive month in May
The LEI’s financial components—led overwhelmingly by stock prices—drove May’s gains

The LEI’s six-month growth rate improved, but remains negative, suggesting slower economic expansion ahead

NOTE: The chart illustrates the so-called 3Ds—duration, depth, and diffusion—for interpreting a downward movement in the LEI. Duration refers to how long the decline has lasted. Depth denotes the size of decline. Duration and depth are measured by the rate of change of the index over the most recent six months at an annualized rate. Diffusion is a measure of how widespread the decline is among the LEI’s component indicators—on a scale of 0 to 100, a diffusion index reading below 50 indicates most components are weakening.
The 3Ds rule signals an impending recession when: 1) the six-month diffusion index lies at or below 50, shown by the black warning signal lines in the chart; and 2) the LEI’s six-month growth rate (annualized) falls below the threshold of −4.3%. The red recession signal lines indicate months when both criteria are met simultaneously—and thus that a recession is likely imminent or underway.
Summary Table of Composite Economic Indexes

The composite business cycle indexes pre- and post- benchmark revisions: 1959-present


About The Conference Board Leading Economic Index® (LEI) and Coincident Economic Index® (CEI) for the US
The composite economic indexes are key elements in an analytic system designed to signal peaks and troughs in the business cycle. Comprised of multiple independent indicators, the indexes are constructed to summarize and reveal common turning points in the economy in a clearer and more convincing manner than any individual component.
The CEI reflects current economic conditions and is highly correlated with real GDP. The LEI is a predictive tool that anticipates—or “leads”—turning points in the business cycle by around seven months.
The ten components of the Leading Economic Index® for the US are:
- Average weekly hours in manufacturing
- Average weekly initial claims for unemployment insurance
- Manufacturers’ new orders for consumer goods and materials
- ISM® Index of New Orders
- Manufacturers’ new orders for nondefense capital goods excluding aircraft orders
- Building permits for new private housing units
- S&P 500® Index of Stock Prices
- Leading Credit Index™
- Interest rate spread (10-year Treasury bonds less federal funds rate)
- Average consumer expectations for business conditions
The four components of the Coincident Economic Index® for the US are:
- Payroll employment
- Personal income less transfer payments
- Manufacturing and trade sales
- Industrial production
To access data, please visit: https://data-central.conference-board.org/
About The Conference Board
The Conference Board is the Member-driven think tank that delivers Trusted Insights for What's Ahead®®. Founded in 1916, we are a nonpartisan, not-for-profit organization holding 501 (c) (3) tax-exempt status in the United States. TCB.org l Learn about Membership