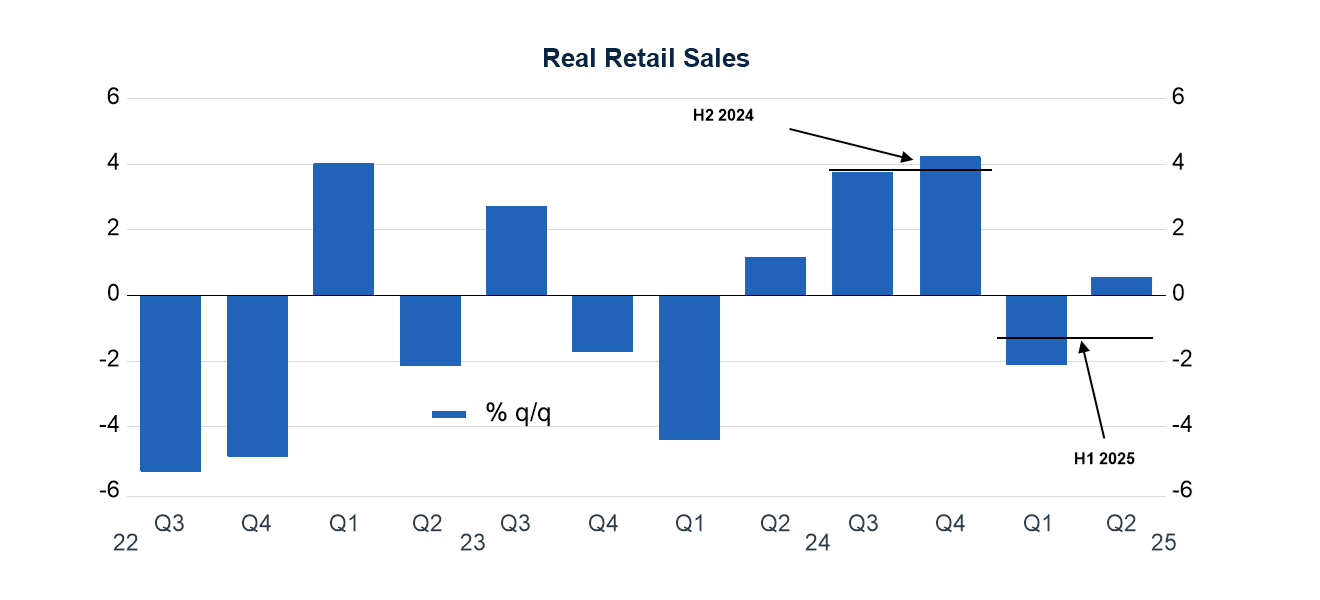
In June, a solid increase in retail sales shows consumers were still spending amid the first signs of tariff pressures. Nonetheless, some signs of slowing are emerging, particularly in categories most affected by tariffs.
Figure 1. Consumer Spending Slowing, but Still Solid

Sources: Census Bureau, Haver Analytics, The Conference Board, 2025

myTCB® Members get exclusive access to webcasts, publications, data and analysis, plus discounts to events.
FOMC Reaction: US Economy In a Good Place, But Staying Vigilant
January 28, 2026
Fed January Decision: Pause or Full Stop?
January 27, 2026
November PCE: Are Consumers Spending Beyond Their Means?
January 22, 2026
Retail Sales Highlight Affordability Issues
January 14, 2026
No, Tamer CPI Does Not Mean Inflation Peaked
January 13, 2026
Exiting International Climate Pacts Will Leave The US Isolated
January 08, 2026

Charts
The Gray Swans Tool helps C-suite executives better navigate today’s quickly developing economic, political, and technological environments.
LEARN MORE
Charts
This index identifies the risk of future labor shortages for specific occupations.
LEARN MORE
Charts
Our goal is to help members see beyond the political dynamic to inform a medium-term view that supports your strategic planning at this difficult juncture.
LEARN MOREAll release times displayed are Eastern Time
Note: Due to the US federal government shutdown, all further releases for The Conference Board Employment Trends Index™ (ETI), The Conference Board-Lightcast Help Wanted OnLine® Index (HWOL Index), The Conference Board Leading Economic Index® of the US (US LEI) and The Conference Board Global Leading Economic Index® (Global LEI) data may be delayed.
PRESS RELEASE
LEI for Spain Increased in December
February 10, 2026
PRESS RELEASE
LEI for South Korea Increased in December
February 09, 2026
PRESS RELEASE
LEI for the Global Economy Decreased in October and November
January 29, 2026
PRESS RELEASE
LEI for China Declined in December
January 28, 2026
PRESS RELEASE
US Consumer Confidence Fell Sharply in January
January 27, 2026
PRESS RELEASE
LEI for India Ticked Down in December
January 26, 2026
Connect and be informed about this topic through webcasts, virtual events and conferences

Vacancies Plunge, But Low Hire-Low Fire Equilibrium Persists
February 05, 2026 | Brief

FOMC Reaction: US Economy In a Good Place, But Staying Vigilant
January 28, 2026 | Brief

Fed January Decision: Pause or Full Stop?
January 27, 2026 | Brief

Economy Watch: US View (January 2026)
January 23, 2026 | Article

The CEO Outlook for 2026—Uncertainty, Risks, Growth & Strategy
January 15, 2026

The Big Picture: What's Ahead for the Global Economy?
December 10, 2025

AI & Talent Transformation: Hiring, Skills, and Workforce Strategy
November 19, 2025

Economy Watch: Trends in Consumer & CEO Confidence
November 12, 2025

Insurance in Crisis: Surging Prices & Risks
November 05, 2025

US Tariffs: What’s Changed, What’s Next
October 15, 2025
