


Loading...


Using the Composite Indexes: The Leading Economic Index (LEI) provides an early indication of significant turning points in the business cycle and where the economy is heading in the near term. The Coincident Economic Index (CEI) provides an indication of the current state of the economy. Additional details are below.
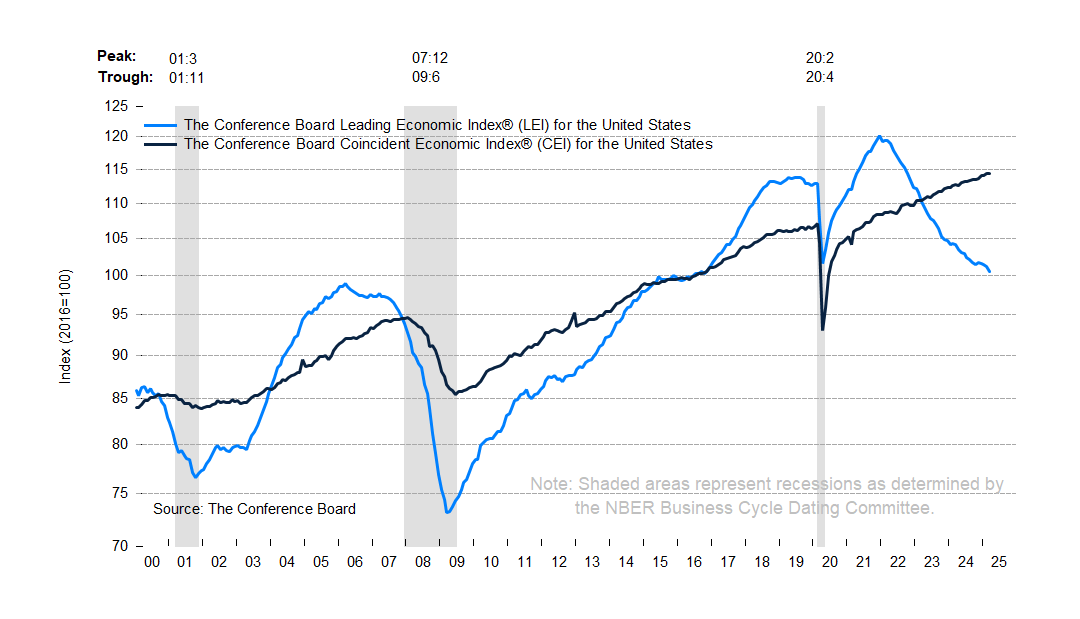
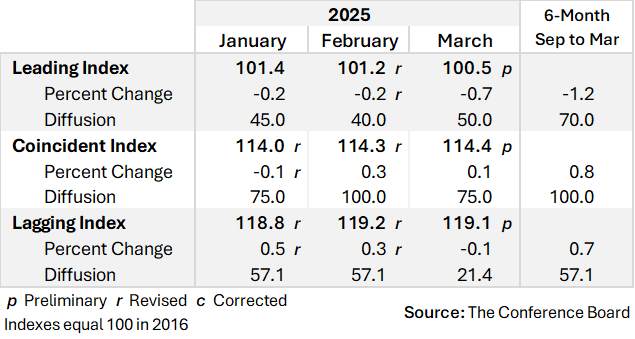
The Conference Board Leading Economic Index® (LEI) for the US declined by 0.7% in March 2025 to 100.5 (2016=100), after a decline of 0.2% (revised up from –0.3%) in February. The LEI also fell by 1.2% in the six-month period ending in March 2025, a smaller rate of decline than its –2.3% contraction over the previous six months (March–September 2024).
“The US LEI for March pointed to slowing economic activity ahead,” said Justyna Zabinska-La Monica, Senior Manager, Business Cycle Indicators, at The Conference Board. “March’s decline was concentrated among three components that weakened amid soaring economic uncertainty ahead of pending tariff announcements: 1) consumer expectations dropped further, 2) stock prices recorded their largest monthly decline since September 2022, and 3) new orders in manufacturing softened. That said, the data does not suggest that a recession has begun or is about to start. Still, the Conference Board downwardly revised our US GDP growth forecast for 2025 to 1.6%, which is somewhat below the economy’s potential. The slower projected growth rate reflects the impact of deepening trade wars, which may result in higher inflation, supply chain disruptions, less investing and spending, and a weaker labor market.”
The Conference Board Coincident Economic Index® (CEI) for the US increased by 0.1% in March 2025 to 114.4 (2016=100), after a 0.3% increase in February. The CEI rose by 0.8% over the six-month period between September 2024 and March 2025, up slightly from its 0.7% growth over the previous six months. The CEI’s four component indicators—payroll employment, personal income less transfer payments, manufacturing and trade sales, and industrial production—are included among the data used to determine recessions in the US. Industrial production, which has declined for the first time since November of 2024, was the only negative contributor in March.
The Conference Board Lagging Economic Index® (LAG) for the US decreased by 0.1% to 119.1 (2016=100) in March 2025, after a 0.3% increase in February. Despite the monthly downtick, the LAG’s six-month growth rate remained positive at 0.7% between September 2024 and March 2025—a reversal of its –0.7% decline over the previous six months (March–September 2024).

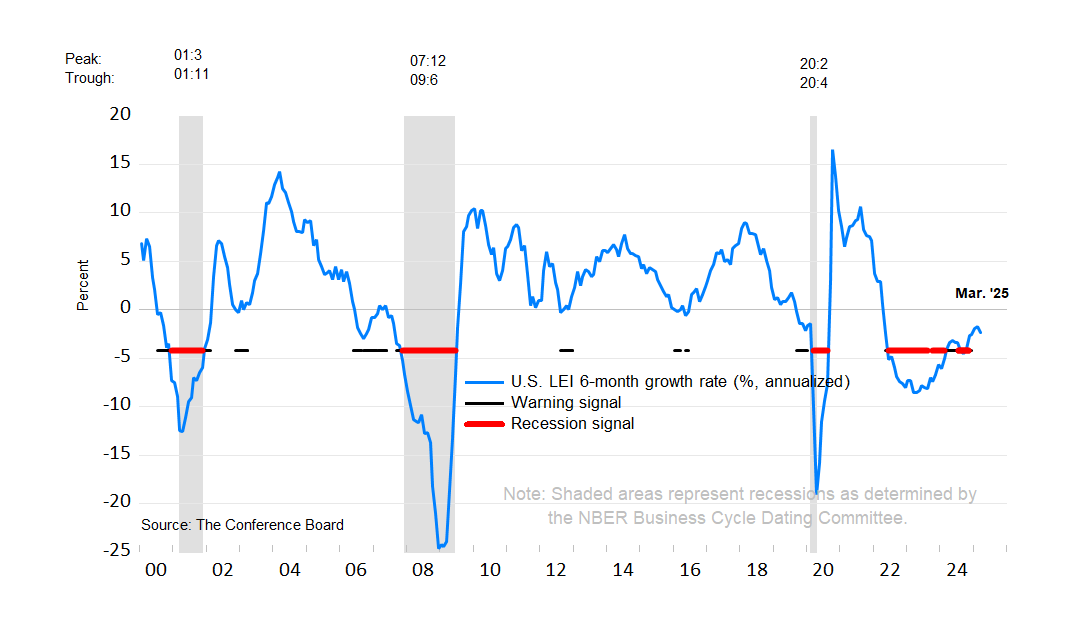
NOTE: The chart illustrates the so-called 3Ds—duration, depth, and diffusion—for interpreting a downward movement in the LEI. Duration refers to how long the decline has lasted. Depth denotes the size of decline. Duration and depth are measured by the rate of change of the index over the most recent six months at an annualized rate. Diffusion is a measure of how widespread the decline is among the LEI’s component indicators—on a scale of 0 to 100, a diffusion index reading below 50 indicates most components are weakening.
The 3Ds rule signals an impending recession when: 1) the six-month diffusion index lies at or below 50, shown by the black warning signal lines in the chart; and 2) the LEI’s six-month growth rate (annualized) falls below the threshold of −4.2%. The red recession signal lines indicate months when both criteria are met simultaneously—and thus that a recession is likely imminent or underway.
About The Conference Board Leading Economic Index® (LEI) and Coincident Economic Index® (CEI) for the US
The composite economic indexes are key elements in an analytic system designed to signal peaks and troughs in the business cycle. Comprised of multiple independent indicators, the indexes are constructed to summarize and reveal common turning points in the economy in a clearer and more convincing manner than any individual component.
The CEI reflects current economic conditions and is highly correlated with real GDP. The LEI is a predictive tool that anticipates—or “leads”—turning points in the business cycle by around seven months.
The ten components of the Leading Economic Index® for the US are:
The four components of the Coincident Economic Index® for the US are:
To access data, please visit: https://data-central.conference-board.org/
About The Conference Board
The Conference Board is the member-driven think tank that delivers Trusted Insights for What’s Ahead®. Founded in 1916, we are a non-partisan, not-for-profit entity holding 501 (c) (3) tax-exempt status in the United States. ConferenceBoard.org
The next release is scheduled for Monday, May 19 at 10 A.M. ET
For further information contact:
Joseph DiBlasi
781.308.7935
jdiblasi@tcb.org
Jonathan Liu
jliu@tcb.org
Connect and be informed about this topic through webcasts, virtual events and conferences
All release times displayed are Eastern Time


June 17, 2022 | Report

April 21, 2022 | Report
August US leading index points to continued economic growth
September 23, 2021 | Chart
Using the Leading Credit IndexTM to Predict Turning Points in the U.S. Business Cycle…
December 20, 2011 | Report
Comprehensive Benchmark Revisions for The Conference Board Leading Economic Index® for th…
December 20, 2011 | Report

The Long-term Economic Outlook for the US, Europe, and China
December 11, 2024
The Evolving Economic Outlook for Europe
July 10, 2024
Inflation, Labor Markets, and the Fed
May 11, 2022
