


Loading...


For Release 9:00 AM ET, April 24, 2025
Using the Composite Indexes: The Leading Economic Index (LEI) provides an early indication of significant turning points in the business cycle and where the economy is heading in the near term. The Coincident Economic Index (CEI) provides an indication of the current state of the economy. Additional details are below.
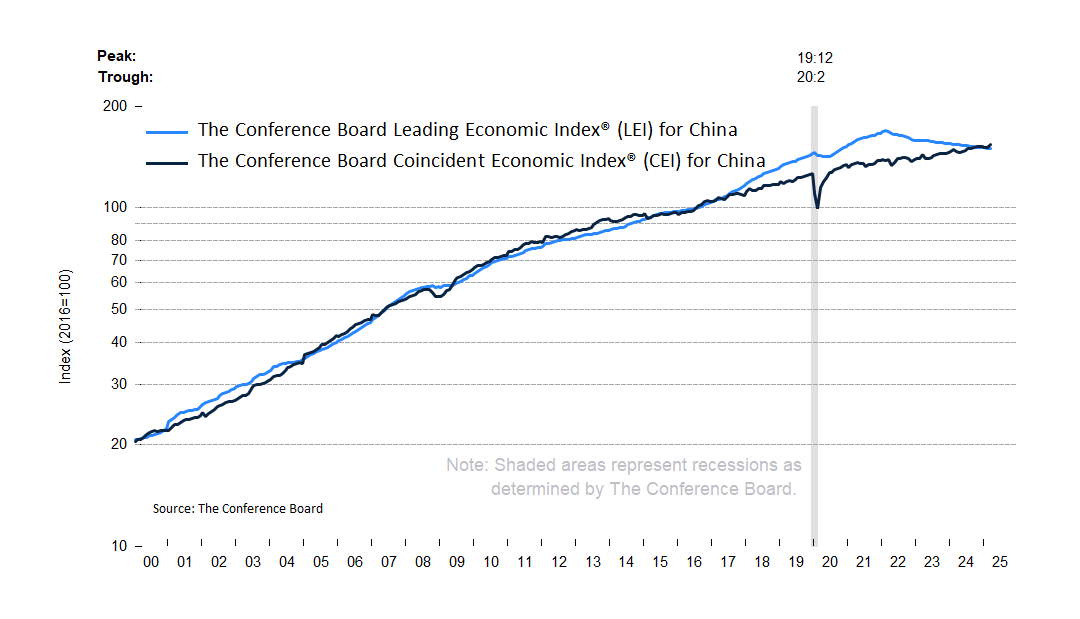
The Conference Board Leading Economic Index®(LEI) for China fell by 0.3% in March 2025 to 149.6 (2016=100), after also decreasing by 0.3% in February. Overall, the LEI declined by 1.4% over the six-month period from September 2024 to March 2025, a slightly faster rate of decline than the 1.3% contraction experienced over the previous six-month period between March and September 2024.
The Conference Board Coincident Economic Index® (CEI) for China increased substantially by 1.7% in March 2025 to 153.4 (2016=100), after being unchanged in February. Overall, the Index grew by 1.9% over the six-month period from September 2024 to March 2025, slower than the 2.5% growth over the previous six-month period.
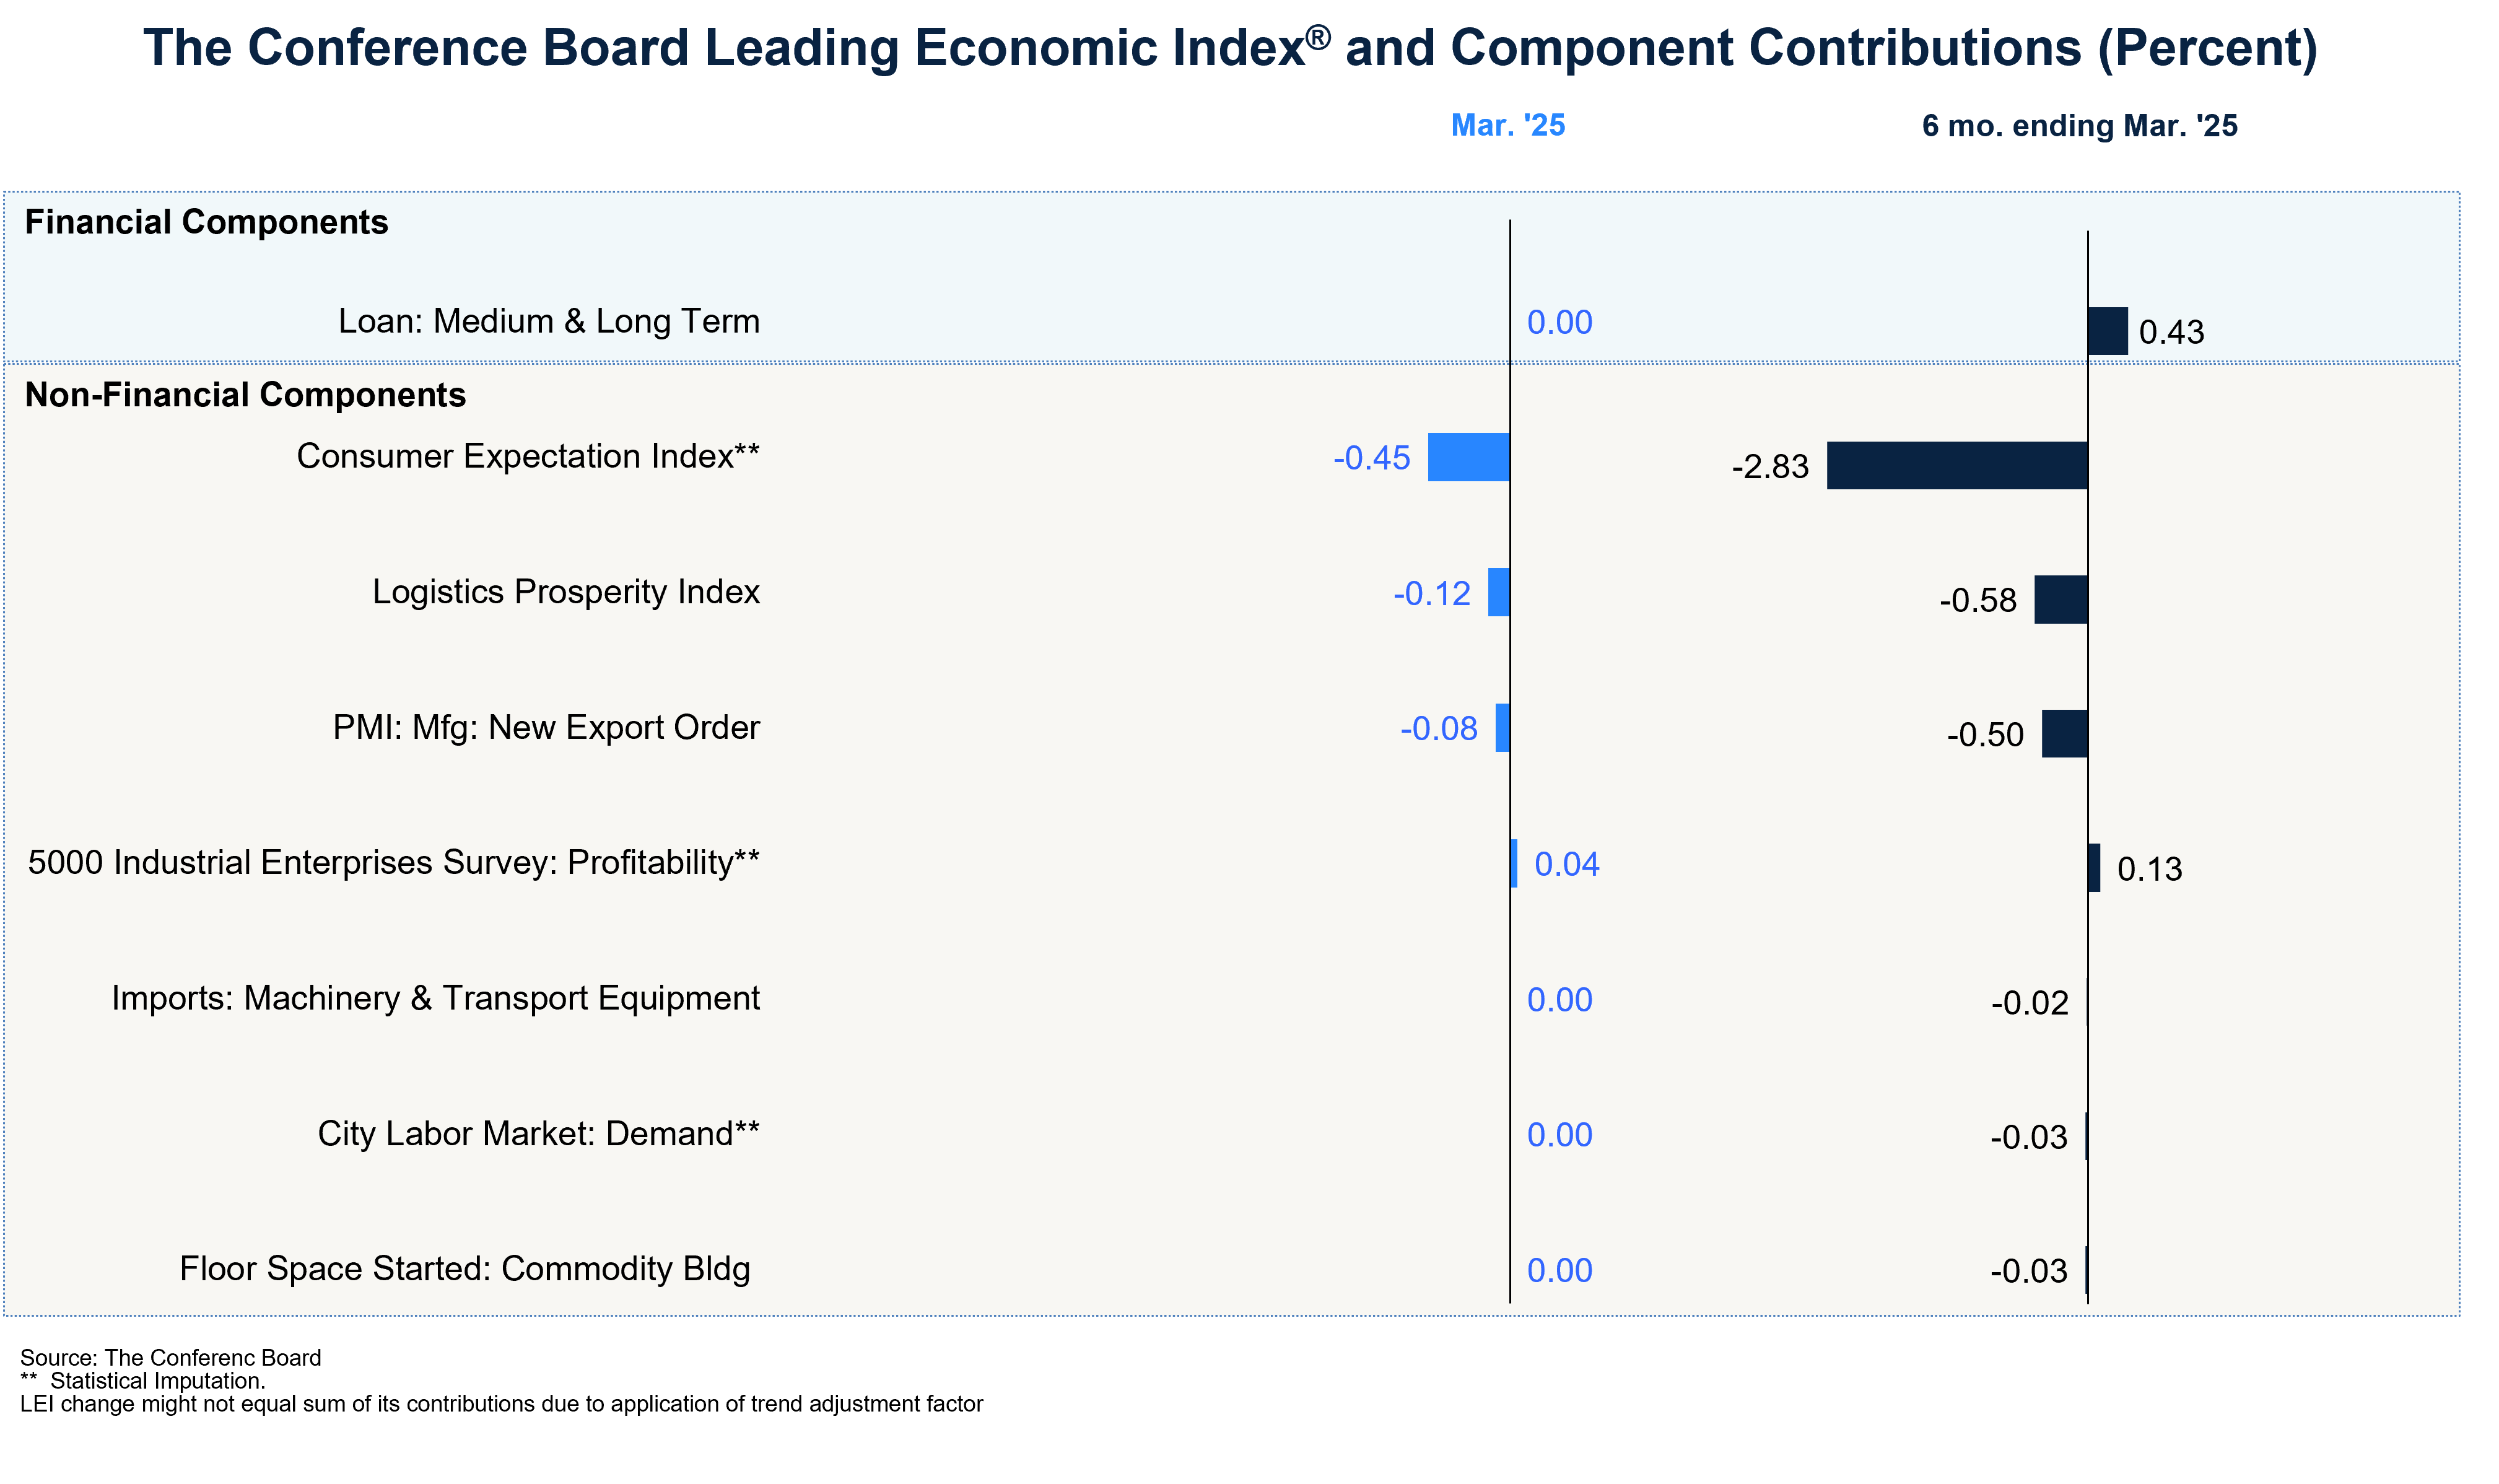
“The China LEI continued to decline in March,” said Justyna Zabinska-La Monica, Senior Manager, Business Cycle Indicators, at The Conference Board. “As in previous months, the decline was driven by three components: depressed consumer expectations, a weak logistics prosperity index and low new export orders in manufacturing. Only profitability increased while the remaining components were unchanged. The six-month and annual growth rates were still negative, but they stabilized at a similar level as in February and March 2025 and continued to suggest softer economic conditions ahead. So far in 2025, activity has remained robust as suggested by the high CEI reading in March and GDP growth at 5.4% YOY in Q1, the same pace as in Q4 of 2024. The Conference Board currently forecasts annual real GDP growth at between 4.5% to 5.0% in 2025 as the Chinese government is committed to support the economy to offset the negative effects of the trade war with the United States.”
The next release is scheduled for Wednesday, May 28, 2025, at 9:00 A.M. ET
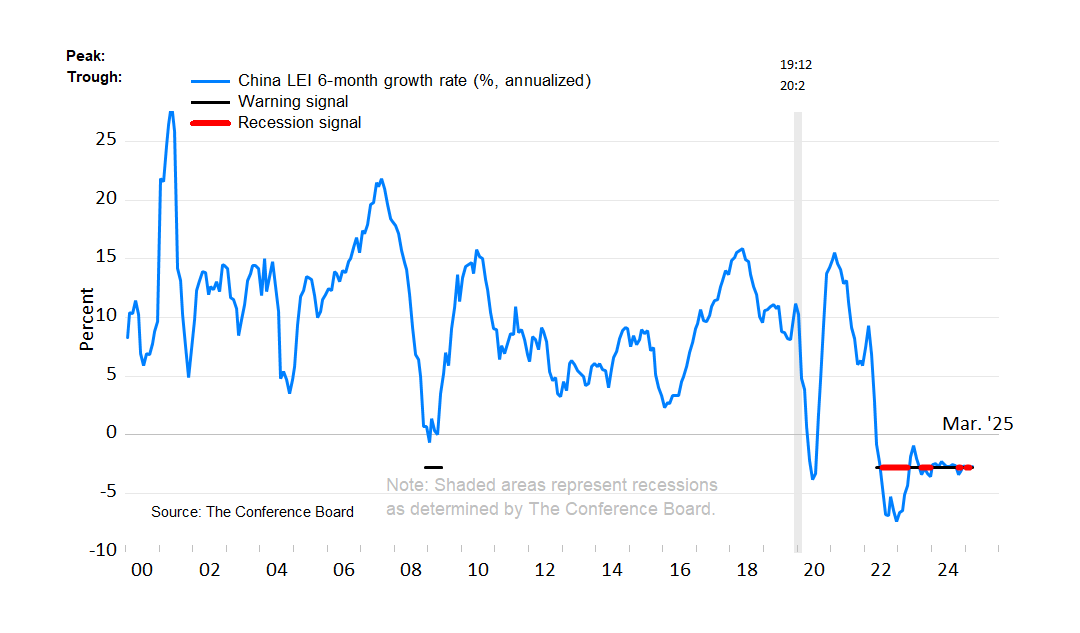
NOTE: The chart illustrates the so-called 3Ds—duration, depth, and diffusion—for interpreting a downward movement in the LEI. Duration refers to how long the decline has lasted. Depth denotes the size of decline. Duration and depth are measured by the rate of change of the index over the most recent six months at an annualized rate. Diffusion is a measure of how widespread the decline is among the LEI’s component indicators—on a scale of 0 to 100, a diffusion index reading below 50 indicates most components are weakening.
The 3Ds rule signals an impending recession when: 1) the six-month diffusion index lies at or below 50, shown by the black warning signal lines in the chart; and 2) the LEI’s six-month growth rate (annualized) falls below the threshold of −2.8%. The red recession signal lines indicate months when both criteria are met simultaneously—and thus that a recession is likely imminent or underway.
About The Conference Board Leading Economic Index® (LEI) and Coincident Economic Index® (CEI) for China
The composite economic indexes are key elements in an analytic system designed to signal peaks and troughs in the business cycle. Comprised of multiple independent indicators, the indexes are constructed to summarize and reveal common turning points in the economy in a clearer and more convincing manner than any individual component.
The CEI reflects current economic conditions and is highly correlated with real GDP. The LEI is a predictive tool that anticipates—or “leads”—turning points in the business cycle by around five months.
The eight components of the Leading Economic Index® for China are:
The four components of the Coincident Economic Index® for China are:
To access data, please visit: https://data-central.conference-board.org/
About The Conference Board
The Conference Board is the member-driven think tank that delivers Trusted Insights for What’s Ahead®. Founded in 1916, we are a non-partisan, not-for-profit entity holding 501 (c) (3) tax-exempt status in the United States. ConferenceBoard.org
PRESS RELEASE
LEI for China Ticked Up in June
July 23, 2026
PRESS RELEASE
LEI for India Remained Unchanged in June
July 22, 2026
PRESS RELEASE
The LEI for the Euro Area fell in June
July 17, 2026
PRESS RELEASE
LEI for Mexico Declined in June
July 17, 2026
PRESS RELEASE
The LEI for France Increased in May
July 16, 2026
PRESS RELEASE
LEI for Brazil increased in June
July 15, 2026
All release times displayed are Eastern Time

July 20, 2026 | Database
Business & Economics Portfolio
June 30, 2026 | Database
June 29, 2026 | Report
The Economy Stabilized in August but Outlook Remains Weak
September 27, 2023 | Report
China's Economic Recovery Continues to Stutter (Economy Watch: China View, June 2023)
June 30, 2023 | Report
Leading Economic Indicators and the Oncoming Recession
December 07, 2022 | Article

The Evolving Economic Outlook for Europe
July 10, 2024
Is a Global Recession on the Horizon?
July 13, 2022
