International Comparisons of Manufacturing Productivity and Unit Labor Costs Trends, 2012
Annual Release of International Comparisons of Manufacturing Productivity and Unit Labor Costs Trends postponed to Spring 2015
The December 2014 update of International Comparisons of Manufacturing Productivity and Unit Labor Costs Trends has been postponed to Spring 2015 as we continue to integrate the dataset with other productivity studies by The Conference Board. The Spring release will include updates through 2013 and preliminary estimates for 2014. The data release will be followed by a report on global productivity trends and its business implications to be published in June.
17 Dec. 2013
In This Report
Summary
Defintions
Charts:
Productivity Charts
Unit Labor Cost Charts
Tables:
Table 1. Productivity (output per hour), output, and hours worked
Table 2. Unit labor costs, compensation, and output
Table 3. Unit labor costs (ULC) in U.S. dollars and in national currency and exchange rates
Summary
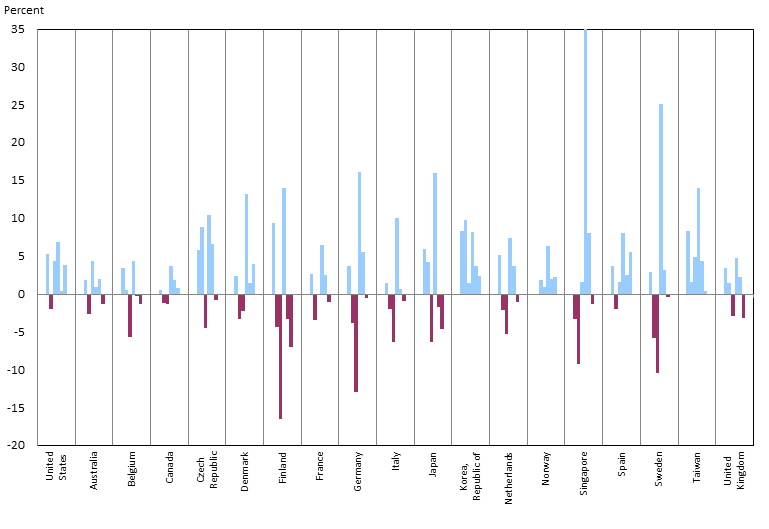
Based on estimates prepared by The Conference Board International Labor Comparisons program, manufacturing productivity performance weakened in 2012 across countries in North America, Europe, and Asia. Manufacturing productivity declined in 12 of 19 countries compared (see Chart 1), and most economies experienced a slowdown in productivity for the second year in a row (see Chart 4). In almost half the countries, except for the 2008/2009 global financial and economic crisis, 2012 manufacturing productivity growth was the lowest seen since the 1980s or earlier.
Productivity rates in the Czech Republic, Finland, the Republic of Korea, Sweden, and Taiwan slowed especially compared to their average growth rates in the 2000-2007 period, when manufacturing productivity in these countries averaged 6 percent or higher (see Table 1).
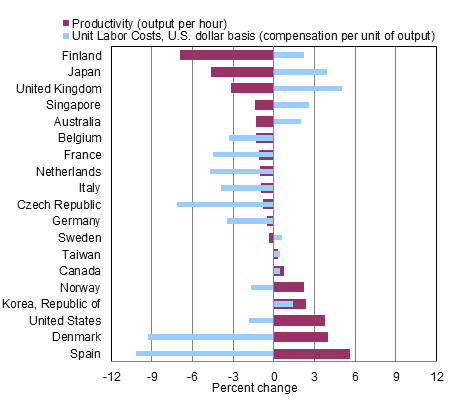
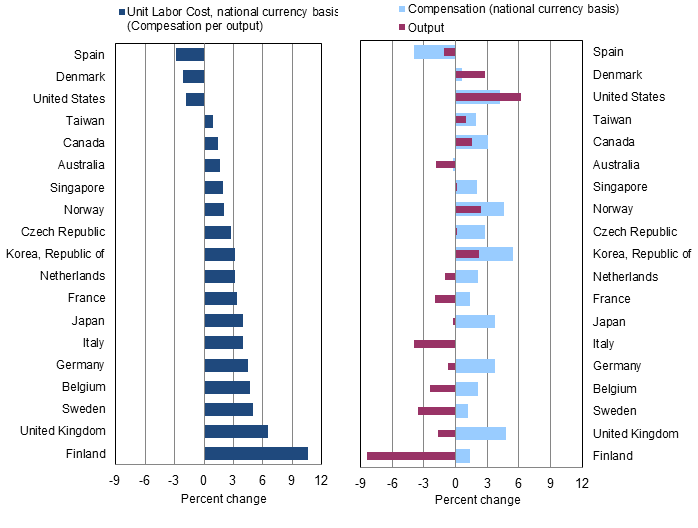
In 2012, manufacturing unit labor costs in national currency terms increased in all but three economies compared (see Chart 5). However, largely due to the appreciation of the U.S. dollar, unit labor costs in U.S. dollar terms decreased in 10 of 19 countries (see Chart 1 and Chart 6). All Euro Area countries compared, except for Finland, saw larger declines in U.S. dollar-based unit labor costs than the U.S., so that these countries gained a competitive edge against U.S. manufacturing in 2012. In contrast, U.S. manufacturing competitiveness improved relative to all Asian economies covered.
Definitions
Productivity is calculated as real output (manufacturing value added) divided by total hours worked in manufacturing. It measures how effectively labor hours are converted into output. Increases in labor productivity indicate that a country's workforce is becoming more efficient.
Unit Labor Costs in National Currency Units are calculated as total compensation (in current prices) divided by real output (in constant prices, that is, adjusted for increases in output prices) in manufacturing. It measures the cost of labor input required to produce one unit of output.
Unit Labor Costs in U.S. Dollars are unit labor costs in national currency units with labor compensation converted to U.S. dollars using currency exchange rates. This measure is used to compare manufacturing competitiveness across countries. Declines in U.S. dollar-denominated unit labor costs indicate that an economy is becoming more cost competitive.
For full definitions and methods, see the Technical Notes.
Chart 1. Productivity and unit labor costs in manufacturing, annual percent change, 2012
Source: The Conference Board, International Labor Comparisons program
Manufacturing productivity (output per hour) decreased in 2012 for 12 of 19 countries compared (see Chart 1). Most economies experienced a slowdown in manufacturing productivity growth for the second year in a row, except the United States, Australia, Denmark, Norway, and Spain (see Chart 4).
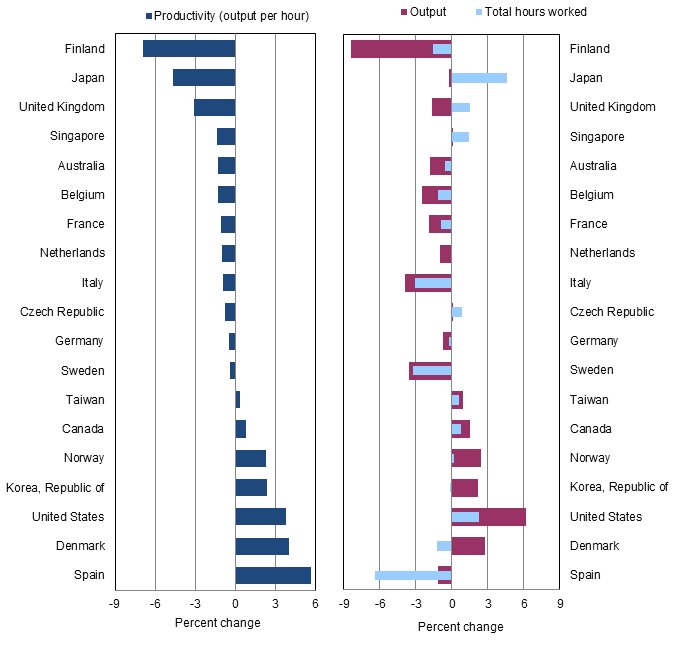
Productivity is the ratio of real output to total hours worked. Changes in productivity are approximately equal to the difference between the change in output and the change in hours worked (see Chart 2 and Table 1). For half the countries that saw a decrease in productivity, such as Finland and France, the trend was driven by falling output despite a modest decline in hours worked. For Japan and the United Kingdom, however, the decline in output was exacerbated by an increase in hours worked, which led to even larger productivity losses.
In contrast, productivity increases, including those for the United States, were primarily the result of gains in output. The main exception was Spain, where the fall in hours far outpaced the decline in output, resulting in the largest productivity increase in 2012 of the countries compared.
Chart 2. Productivity, output, and hours worked in manufacturing, annual percent change, 2012
Source: The Conference Board, International Labor Comparisons program
For most countries compared, manufacturing output was the main driver of productivity changes in 2012, as the magnitude of the change in output (whether positive or negative) was generally greater than the magnitude of the change in hours worked (see Table 1). On average, between 2007 and 2012, manufacturing output contracted in over two-thirds of the economies compared, reflecting the effects of the 2008/2009 financial and economic crisis. All countries compared, except Australia, the Republic of Korea, Singapore, and Taiwan, saw record declines in manufacturing output in 2009. However, manufacturing output recovered strongly in all countries in 2010, with Germany and Sweden posting record output growth (20.1 percent and 27.5 percent, respectively) following record declines the previous year. In 2012, the trend in output was more mixed with decline rather than growth in output in more than half the countries compared.
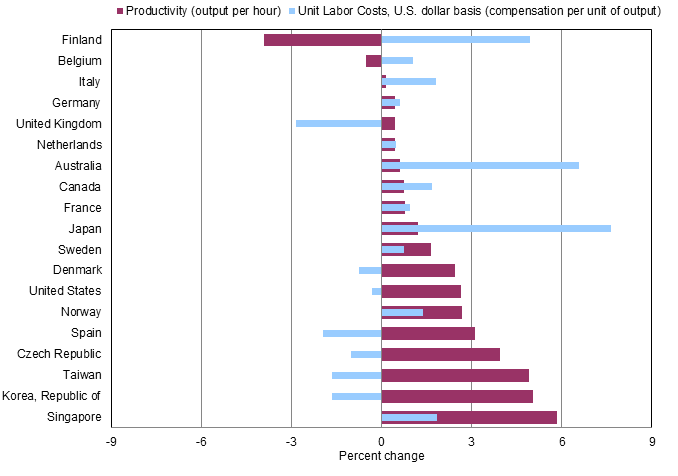
Chart 3. Productivity and unit labor costs in manufacturing, annual percent change, 2007 - 2012
Source: The Conference Board, International Labor Comparisons program
The 2008/2009 global financial and economic crisis also had a significant impact on manufacturing productivity performance in the countries compared (see Chart 3 and Table 1). In the period 2007 to 2012, manufacturing productivity was weakest across the Euro Area. In particular, manufacturing in Finland and Belgium became less competitive internationally as these countries experienced both falling productivity and rising unit labor costs in U.S. dollar terms. Manufacturing in Spain, however, became increasingly competitive with rising productivity and falling unit labor costs, because of a much faster decline in hours and labor compensation than the drop in manufacturing output. All Asian economies compared, except Japan, also saw relatively strong productivity growth in manufacturing. Manufacturing competitiveness in Taiwan and the Republic of Korea also improved substantially in the last five years, but in contrast to Spain, stronger competitveness resulted from larger increases in output than labor compenstion and hours worked, rather than bigger declines in compensation and hours relative to output.
On an annual basis, however, productivity performance in recent years following the global slowdown was more mixed (see Chart 4). In 2010, a majority of the countries compared—most notably Denmark, Finland, Germany, Japan, Singapore, and Sweden—experienced record, or near record, productivity growth as manufacturing activity recovered from the immediate effects of the emergence of the global financial and economic crisis. However, since then, manufacturing productivity has been weakening. In almost half the countries, except for the 2008/2009 recession, 2012 manufacturing productivity growth was the lowest seen since the 1980s or earlier.
Chart 4. Manufacturing productivity (output per hour), annual percent change, 2007-2012
Source: The Conference Board, International Labor Comparisons program
Unit labor costs (ULC) are the direct link between productivity and the cost of labor required in generating output, and are calculated as the ratio of total labor compensation to real output. Therefore, the change in ULC is composed of the change in compensation and the change in output (see Chart 5 and Table 2). In 2012, ULC in national currency terms increased in all countries compared except Spain, Denmark, and the United States. Labor compensation rose in 16 of 19 countries and falling output in over half the countries intensified the rise in ULC. Thus, in 2012, output did not keep up with compensation gains in most countries compared. Only in Denmark and the United States did output growth offset increases in compensation, resulting in falling ULC in those countries. In Spain the fall in labor compensation offset the decline in output, causing the largest decline.
Chart 5. Unit labor cost, compensation, and output in manufacturing, annual percent change, 2012
Source: The Conference Board, International Labor Comparisons program
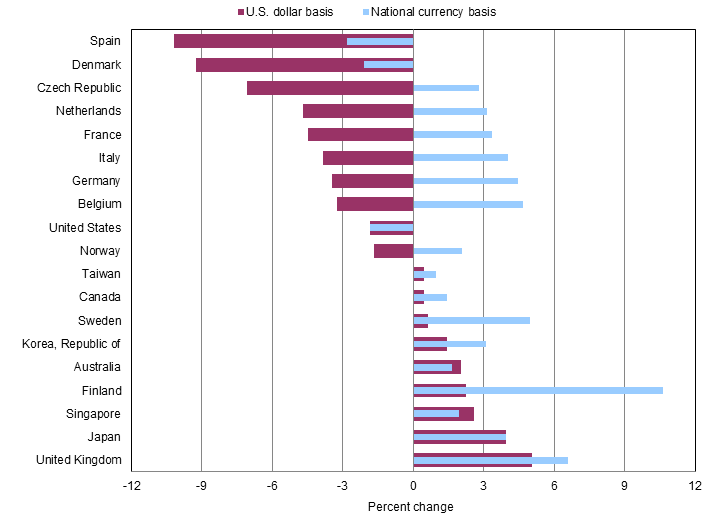
For international comparisons, the labor compensation components in the ULCs are converted into a common currency, in this case U.S. dollars. Changes in a country’s ULC in U.S. dollars are roughly equivalent to the change in ULC in national currency plus the change in the value of the country’s currency relative to the U.S. dollar (see Table 3). The national currencies of 15 of 19 countries compared depreciated relative to the U.S. dollar in 2012. As a result of the weakening currencies, ULC in U.S. dollars showed a larger decrease (or smaller increase) than ULC expressed in national currencies, except for Singapore, Australia, and Japan (see Chart 6).
Despite almost across the board increases in ULC in national currency units, when expressed in U.S. dollars, the results are mixed. In U.S. dollar terms, when ULC in other countries rise faster (or decline slower) than ULC in the United States, U.S. cost competitiveness improves. In 2012, due to the appreciation of the U.S. dollar, unit labor costs in U.S. dollar terms increased in 9 of the 19 countries covered, compared to 16 out of the 19 countries without an adjustment for dollar appreciation (see Chart 6). Therefore, U.S. manufacturing increased competitiveness against all countries where ULC in U.S. dollars rose, as well as Norway. Noteably, U.S. competitivness increased against all Asian countries compared (Taiwan, the Republic of Korea, Singapore, and Japan) and had the largest improvement against the United Kingdom. On the other hand, the U.S. competitive position deteriorated against 8 of 19 countries, most noteably Spain and other Euro Area economies, which saw greater declines in U.S. dollar-based ULC than the United States.
Chart 6. Manufacturing unit labor costs, annual percent change, 2012
Source: The Conference Board, International Labor Comparisons program
The use of all TCB data and materials is subject to the Terms of Use. Reprint requests are reviewed individually and may be subject to additional fees. TCB reserves the right to deny any request.


