An aggregate of eight labor-market indicators that shows underlying trends in employment conditions. Data series: 1973 – present.
The Conference Board Employment Trends Index™ (ETI) Increased in April
Latest Press Release
Updated: Monday, May 11, 2026
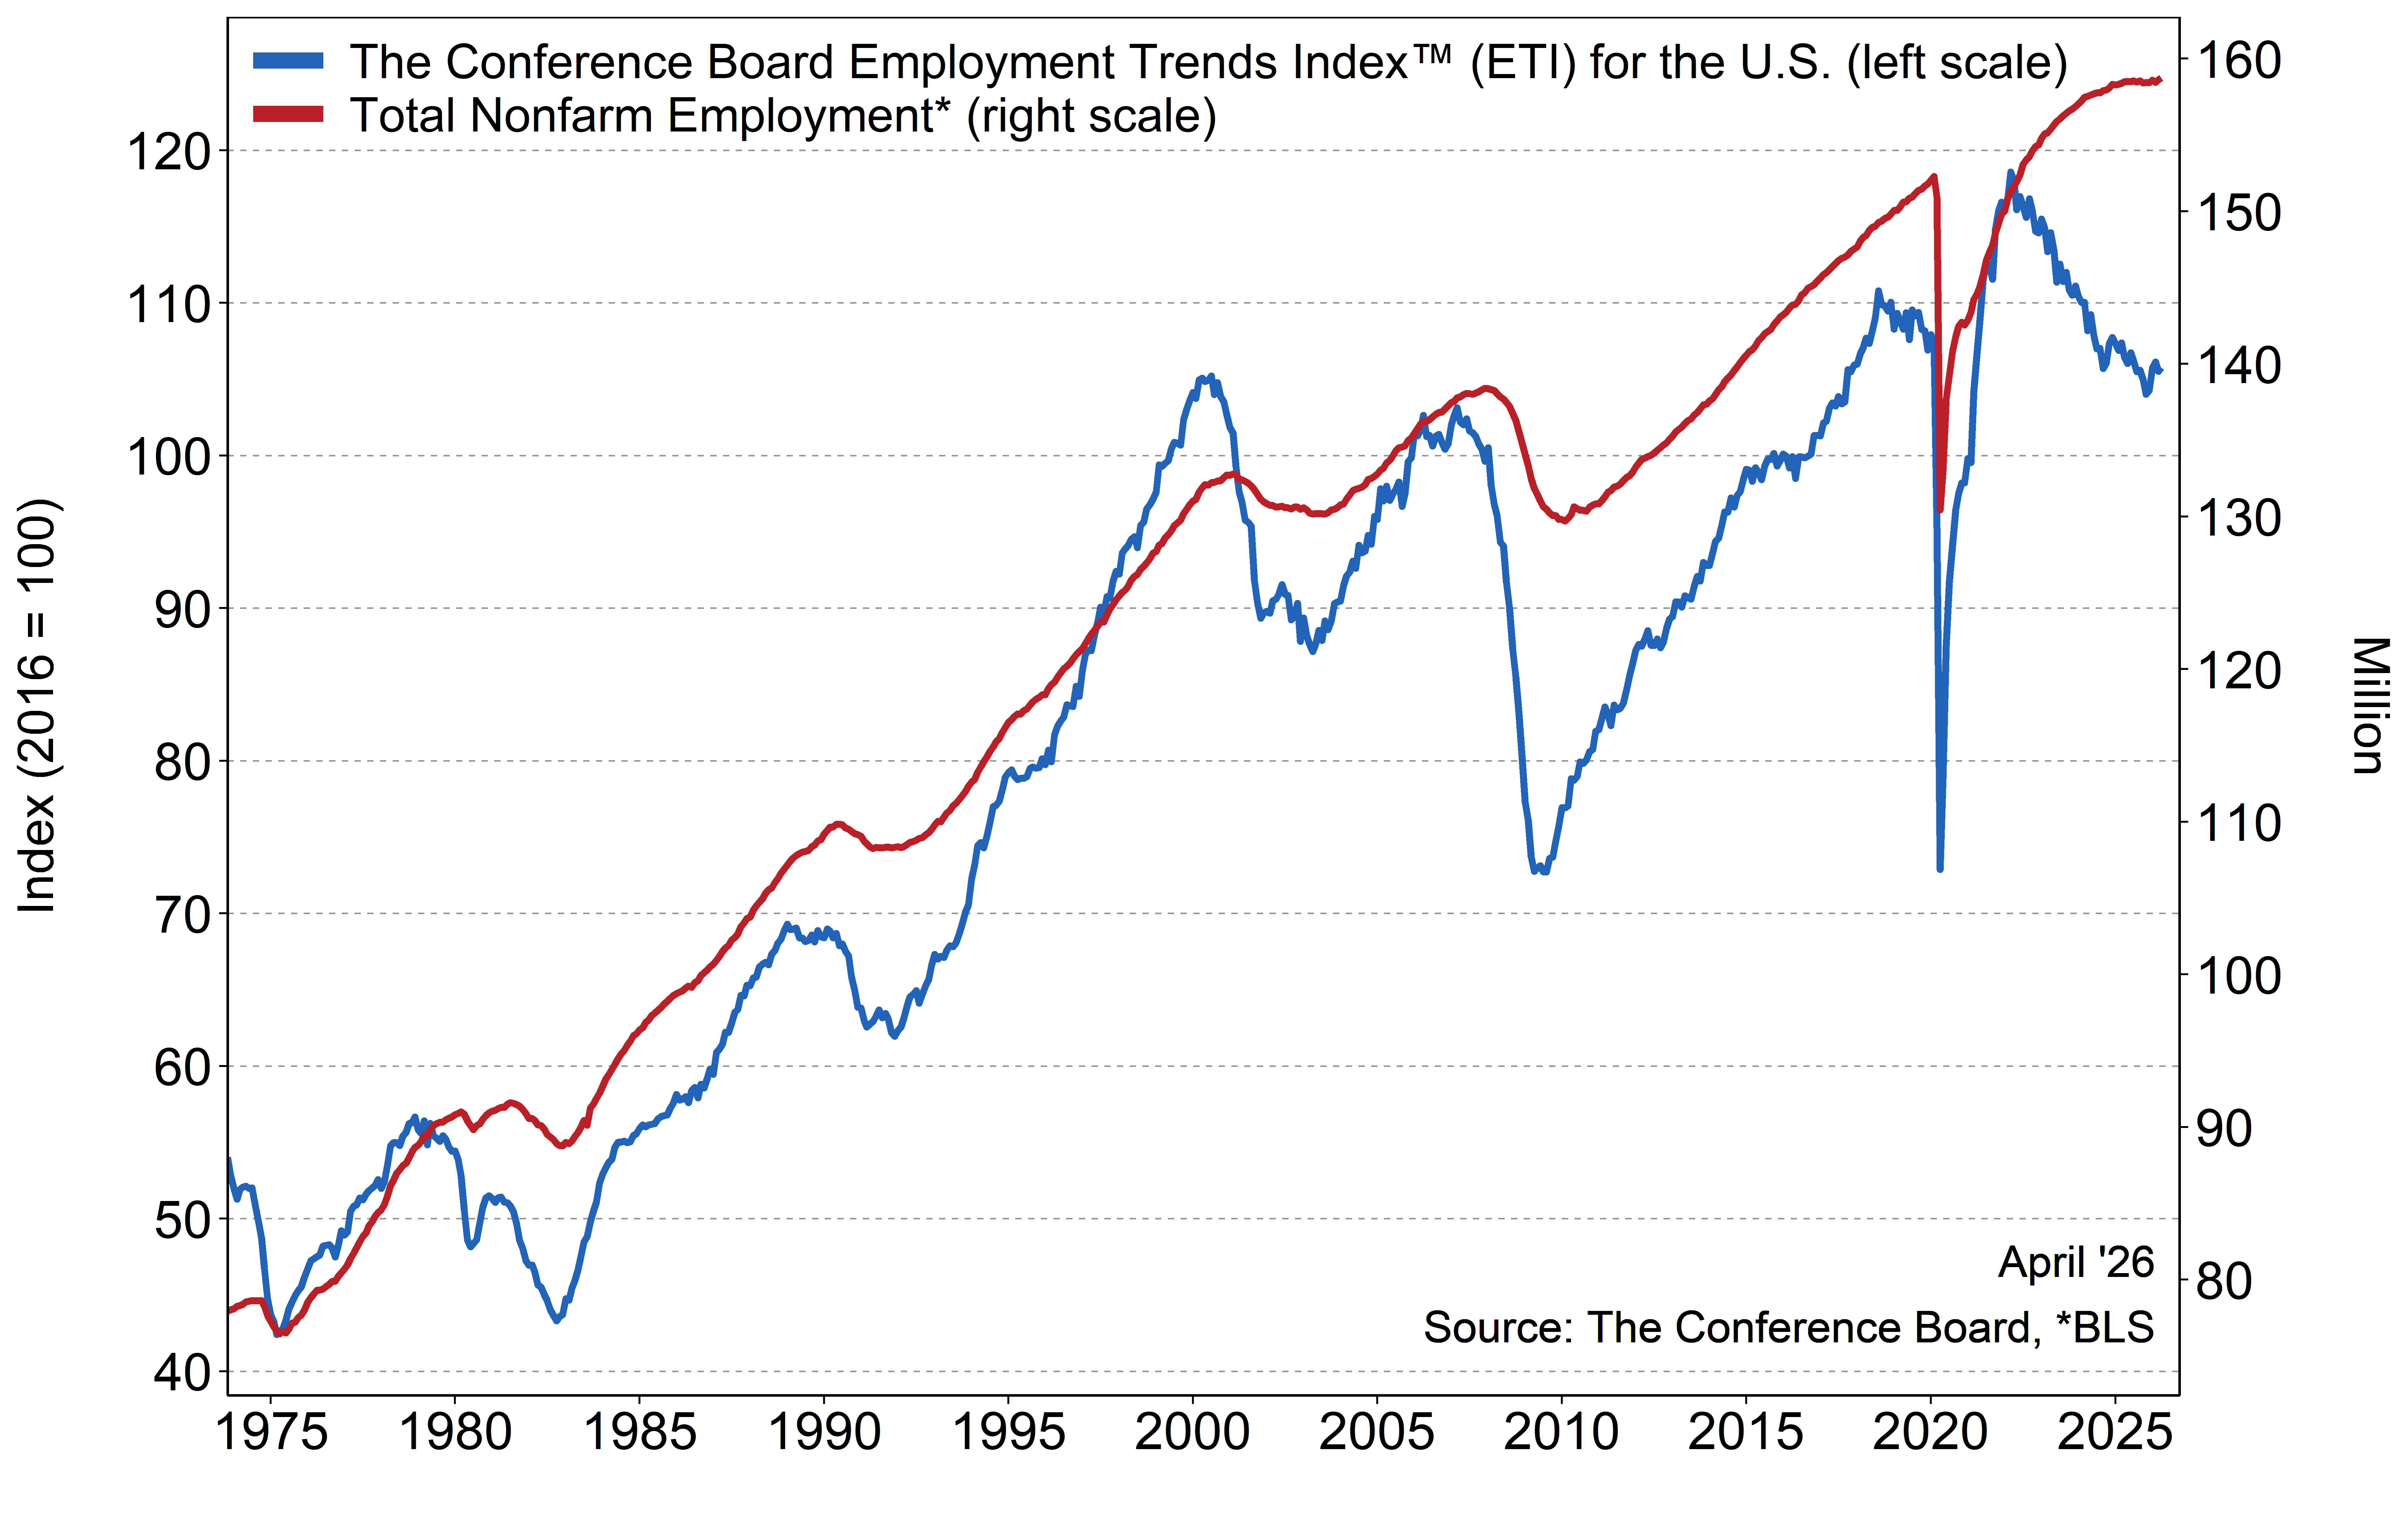
The Conference Board Employment Trends Index™ (ETI) increased to 105.77 in April, from a downwardly revised reading of 105.52 in March. The Employment Trends Index is a leading composite index for payroll employment. When the Index increases, employment is likely to grow as well, and vice versa. Turning points in the Index indicate that a change in the trend of job gains or losses is about to occur in the coming months.
“The ETI rose in April on the back of a healthy Employment Report,” said Mitchell Barnes, Economist at The Conference Board. “The index’s recent stability is a notable break from the ETI’s downward drift throughout 2025. The private sector has gained momentum, while federal government jobs continue to decline.”
Two components were the greatest drivers of the increase in ETI activity. The share of consumers who report “jobs are hard to get”—an ETI component from the Consumer Confidence Survey®—declined 1.5 percentage points to 19.8% in April, the lowest since the beginning of the year. The share of small firms reporting that jobs are ‘not able to be filled right now’ increased from 32% to 34%, rising to its highest level since June 2025.
“This month’s increase in the ETI was broad-based with positive contributions from 7 of its 8 components, which underscored the labor market’s continued resilience,” added Barnes. “However, challenges to the outlook include potential economic disruptions from geopolitical tensions as well as AI-driven layoff announcements.”
Initial claims for unemployment insurance declined to 203,300 in April, continuing to fall from 2025 levels and reaching a near-historic low at the end of April. Employment in the temporary help services industry rose this month, now contributing positively to the ETI for four consecutive months. Both industrial production and real manufacturing and trade sales increased slightly in April. The only negative contribution came from the share of involuntary part-time workers, which rose to 17.9%, slightly above the 2025 average of 17.5%.
April’s increase in the Employment Trends Index was a result of positive contributions from seven of its eight components: the Percentage of Respondents Who Say They Find ‘Jobs Hard to Get’, the Percentage of Firms with Positions Not Able to Fill Right Now, Job Openings, Initial Claims for Unemployment Insurance, Real Manufacturing and Trade Sales, the Number of Employees Hired by the Temporary-Help Industry, and Industrial Production. One component contributed negatively: the Ratio of Involuntarily Part-time to All Part-time Workers.
The Conference Board Employment Trends Index ™, November 1973 to Present
The eight leading indicators of employment aggregated into the Employment Trends Index include:
- Percentage of Respondents Who Say They Find “Jobs Hard to Get” (The Conference Board Consumer Confidence Survey®)
- Initial Claims for Unemployment Insurance (U.S. Department of Labor)
- Percentage of Firms with Positions Not Able to Fill Right Now (© National Federation of Independent Business Research Foundation)
- Number of Employees Hired by the Temporary-Help Industry (U.S. Bureau of Labor Statistics)
- Ratio of Involuntarily Part-time to All Part-time Workers (BLS) ?
- Job Openings (BLS)*
- Industrial Production (Federal Reserve Board)*
- Real Manufacturing and Trade Sales (U.S. Bureau of Economic Analysis)**
*Statistical imputation for the recent month
**Statistical imputation for two most recent months (due to data release delays)
? Note missing October 2025 value for Ratio of Involuntarily Part-time Workers estimated using linear interpolation
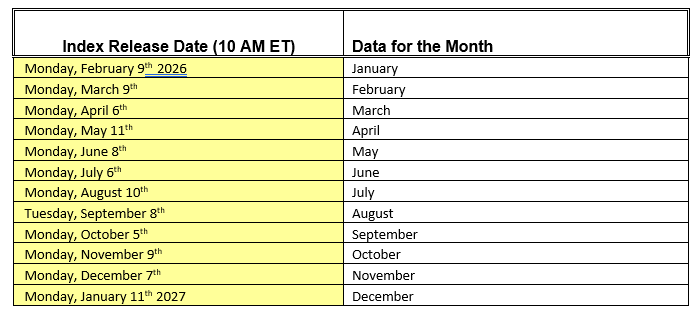
The Conference Board publishes the Employment Trends Index monthly, at 10 a.m. ET, on the Monday that follows each Friday release of the Bureau of Labor Statistics Employment Situation report. The technical notes to this series are available on The Conference Board website: http://www.conference-board.org/data/eti.cfm.
About The Conference Board
The Conference Board is the member-driven think tank that delivers Trusted Insights for What’s Ahead®. Founded in 1916, we are a non-partisan, not-for-profit entity holding 501 (c) (3) tax-exempt status in the United States. www.conference-board.org.
|
Employment Trends Index (ETI)™ 2026 Publication Schedule |