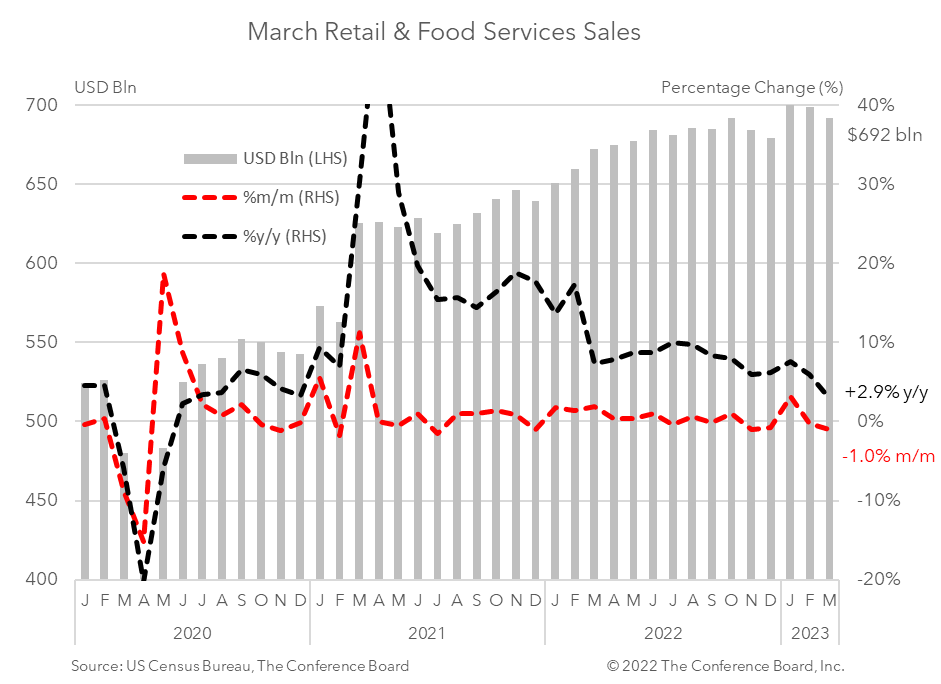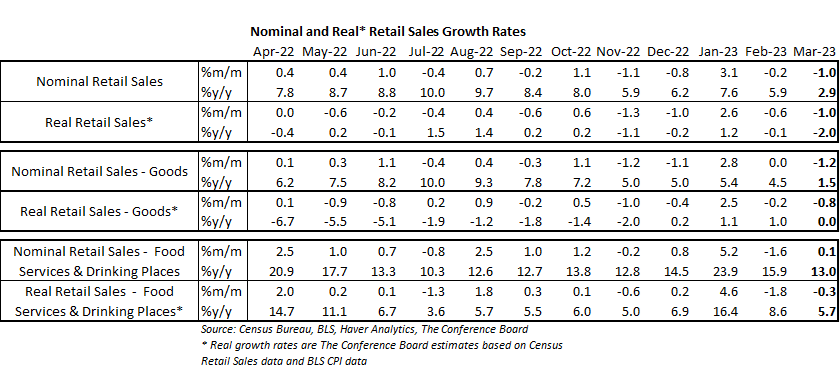
Retail sales slipped for a second month in March following a spike in January. Total sales fell by 1.0 percent month-over-month, but were up 2.9 percent from a year earlier in nominal terms. After adjusting for CPI inflation, which was roughly flat in March in month-over-month terms, real retail sales growth fell 1.0 percent.* Unseasonably warm weather in January resulted in a surge in spending that month that will likely bolster real consumer spending for the full quarter. This is consistent with our April US GDP forecast. However, spending data for February and March resumed a weakening trend that began in late 2022. We expect more spending weakness ahead as the US economy falls into a brief and mild recession starting next quarter. Consumer demand for goods stalled in March—falling by 1.2 percent from the previous month in nominal terms. Spending on motor vehicles and parts fell by 1.6 percent in March from February, while retail sales excluding motor vehicles and parts fell by 0.8 percent. Spending at gasoline stations fell 5.5 percent from the month prior. Retail sales less motor vehicles, gasoline, and building supplies (known as “Retail Control”) fell by 0.3 percent from the previous month. When adjusting goods spending for CPI inflation, the real growth rate was about -0.8 percent from the previous month.* Meanwhile, spending at food services and drinking places rose by a modest 0.1 percent month-over-month, vs. up 5.6 percent in January. However, after adjusting for CPI inflation the real growth rate was about -0.3 percent from the previous month.* * Real growth rates are The Conference Board estimates based on Census Retail Sales data and BLS CPI data

Shutdown Aside, Growth Moderates Under Inflationary Pressures
February 20, 2026
January CPI Raises More Questions than Provides Answers
February 13, 2026
Lukewarm Holiday Shopping in 2025 Augurs Slower Spending in Q4
February 10, 2026
FOMC Reaction: US Economy In a Good Place, But Staying Vigilant
January 28, 2026
Fed January Decision: Pause or Full Stop?
January 27, 2026
November PCE: Are Consumers Spending Beyond Their Means?
January 22, 2026
Charts
US Inflation Expectations Remain High As Inflation Surges
LEARN MORE
Charts
A special poll conducted in the March Consumer Confidence Survey focused on the perceived impact of the war in Ukraine on overall inflation in the US.
LEARN MORECharts
March Consumer Confidence Rises Despite Headwinds
LEARN MORECharts
The Conference Board Consumer Confidence Index® declined in November, following an increase in October. The Index now stands at 109.5 (1985=100), down from 111.
LEARN MORECharts
Global consumer confidence advanced to another record high in the third quarter of 2021..
LEARN MORECharts
The Conference Board Consumer Confidence Index® declined again in September, following decreases in both July and August. The Index now stands at 109.3 (1985=100), do…
LEARN MORECharts
The Conference Board Consumer Confidence Index® (CCI) was relatively unchanged in July, following gains in each of the prior five months. The Index now stands at 129.…
LEARN MORECharts
Consumer confidence for Asia-Pacific declined slightly in the second quarter of 2021.
LEARN MORECharts
Global consumer confidence ticked up to another record high in the second quarter of 2021, according to The Conference Board® Global Consumer Confidence Survey, as ec…
LEARN MORECharts
The Conference Board Consumer Confidence Index® (CCI) improved further in June, following gains in each of the previous four months. The Index now stands at 127.3 (19…
LEARN MOREPRESS RELEASE
US Consumer Confidence Fell Sharply in January
January 27, 2026
PRESS RELEASE
Men Lead Spending on “Little Luxuries” amid Growing Economic Caution
November 19, 2025
PRESS RELEASE
Americans Likely to Tighten Their Belts this Holiday Season
November 11, 2025
PRESS RELEASE
New Data Reveal the Demographic Divides Driving US Consumer Confidence
October 23, 2025
PRESS RELEASE
The Conference Board Launches Consumer Confidence Survey® Premium Dataset
October 23, 2025
IN THE NEWS
Dana M. Peterson: Where Consumer Confidence is headed
September 07, 2025
All release times displayed are Eastern Time
Note: Due to the US federal government shutdown, all further releases for The Conference Board Employment Trends Index™ (ETI), The Conference Board-Lightcast Help Wanted OnLine® Index (HWOL Index), The Conference Board Leading Economic Index® of the US (US LEI) and The Conference Board Global Leading Economic Index® (Global LEI) data may be delayed.
Connect and be informed about this topic through webcasts, virtual events and conferences

The End of Student Loan Relief: Another Headwind for Consumer Spending
August 07, 2025 | Quick Take
How Businesses Can Succeed as US Consumers Guard Wealth, Health Amid Uncertainty
May 12, 2025 | Article

Social Standing: Current Attitudes About Social Media
April 02, 2025 | Article

Politics Shapes US Consumer Views About 2025
February 10, 2025 | Report

US Consumers Hope for Lower Prices and Taxes in 2025
December 17, 2024 | Article

Priced Out: The State of US Housing Affordability
February 11, 2026

Economy Watch: Trends in Consumer & CEO Confidence
November 12, 2025
C-Suite Perspectives

The State of the Economy for August 2024
August 27, 2024
C-Suite Perspectives

The State of the Economy for July 2024
July 30, 2024
