Trusted Insights for What’s Ahead®
The Debt Crisis is here – the US national debt, the amount of money that the Treasury has borrowed and not yet repaid to meet its spending obligations, recently reached a record $36.7 trillion. Government spending also exceeded government revenues by $1.9 trillion in Fiscal Year 2024. Combined with rising costs to service the national debt and the impending insolvency of the Social Security and Medicare trust funds over the next decade, the US faces a challenging fiscal outlook that will only continue to worsen absent immediate action from federal policymakers.
This explainer provides an overview of the national debt; historical, demographic, and economic trends that have influenced the debt’s growth; and the impact of the outsized levels of national debt on the Federal government and the economy, along with CED’s recommendations to address the Debt Crisis.
- Annual budget deficits lead the Federal government to borrow money to cover the gap between spending and revenues, increasing the national debt.
- Most of the national debt is held by domestic and foreign investors (“the public”), though foreign ownership of the debt as a percentage of the total debt has declined in the past decade.
- The broader trends of an aging population, rising health care costs, rising costs of servicing the debt, and lower economic growth and government revenues are the primary drivers of the rising national debt.
- In the 21st century, the national debt has increased significantly because of government responses to major events including the September 11 terror attacks, the Great Recession of 2008, and the COVID-19 pandemic, highlighting the need for a sustainable level of national debt to be able to respond to future geopolitical crises.
- The Debt Crisis is here. The outsized and unsustainable national debt poses significant challenges to the Federal government, US economy, and society at large, and the costs of inaction are only rising. The servicing of the outsized national debt will crowd out other national priorities and may cause a loss of confidence in the Federal government’s ability to repay the debt. This will have adverse impacts on the economy, particularly on the Federal government’s credit rating, the higher interest rates that the US Treasury must pay investors to compensate for the greater risk of default, and the value of the US dollar as investors seek safer investments.
- Consequently, given the size and breadth of the US economy and the US global leadership role, both global security and economic stability and growth will be adversely impacted.
- The cost of servicing the national debt is also projected to grow to historic levels over the next decade because of higher spending and higher interest rates, which makes financing additional debt more expensive and further exacerbates the Debt Crisis.
- The debt-to-GDP ratio shows the burden of the national debt relative to the country’s total economic output and reveals the United States’ ability to pay down its debt. Public debt stands today at its highest level since World War II – 100 percent – and is projected to grow even higher in the next decade. Based on examples from international financial institutions, the recent past, and econometric analysis, CED recommends a public debt-to-GDP ratio of no higher than 70 percent, still high historically – but a more stable and sustainable level of debt burden. To get down to this debt ratio will take time. We must start taking action now.
What Is the National Debt?
The Treasury Department defines the US national debt as the amount of money the Federal government has borrowed to cover the outstanding balance of expenses incurred over time. The budget deficit results from government spending exceeding the revenue the government collects in a given fiscal year, and the Federal government must sell Treasury securities to borrow money and cover the amount of spending that exceeds revenues. The national debt is thus the total accumulated borrowing from selling Treasury securities over the course of the nation’s history that has not yet been repaid.
Given the relation of the Federal government’s annual budget to the national debt, it is important to understand the major components of the Federal budget:
- Mandatory spending is spending required by law that falls outside the regular Congressional appropriations process because the relevant laws mandate this spending based on statutory formulas. This principally includes funds for Social Security benefits and healthcare, which includes a significant portion of Medicare and the Federal share of Medicaid (a joint Federal-state program). In Fiscal Year 2024, Social Security benefits comprised 32 percent of mandatory spending and the major Federal healthcare programs were 41 percent of mandatory spending. It also includes some income security programs such as the Supplemental Nutrition Assistance Program (SNAP), student loan programs, and some veterans’ programs. Mandatory spending is the largest share of government spending, accounting for about two-thirds of total spending. Congress reserves the right to change the conditions under which mandatory spending programs operate.
- Discretionary spending is subject to annual appropriations set by Congress. The 12 appropriations bills fund all other government programs for major US national priorities, including national defense, infrastructure, transportation, education, housing, and social service programs.
- Net interest spending is money that the Federal government pays to investors that own Treasury securities. Interest payments on the national debt are a type of mandatory spending to compensate investors for buying US debt – otherwise, the government would default on its obligations – and have been growing recently as a proportion of the Federal budget because of rising deficits and interest rates. In Fiscal Year 2024, net interest spending was $881 billion and comprised 13 percent of total Federal government spending. The Congressional Budget Office projects net interest spending to grow to $1.8 trillion in 2035, representing 17 percent of total government spending and equal to 4.1 percent of GDP.
- Revenues are money that the Federal government collects to fund all the spending listed above. The primary sources of Federal revenues are individual income taxes, payroll taxes that fund Social Security and Medicare, and taxes on corporate income.
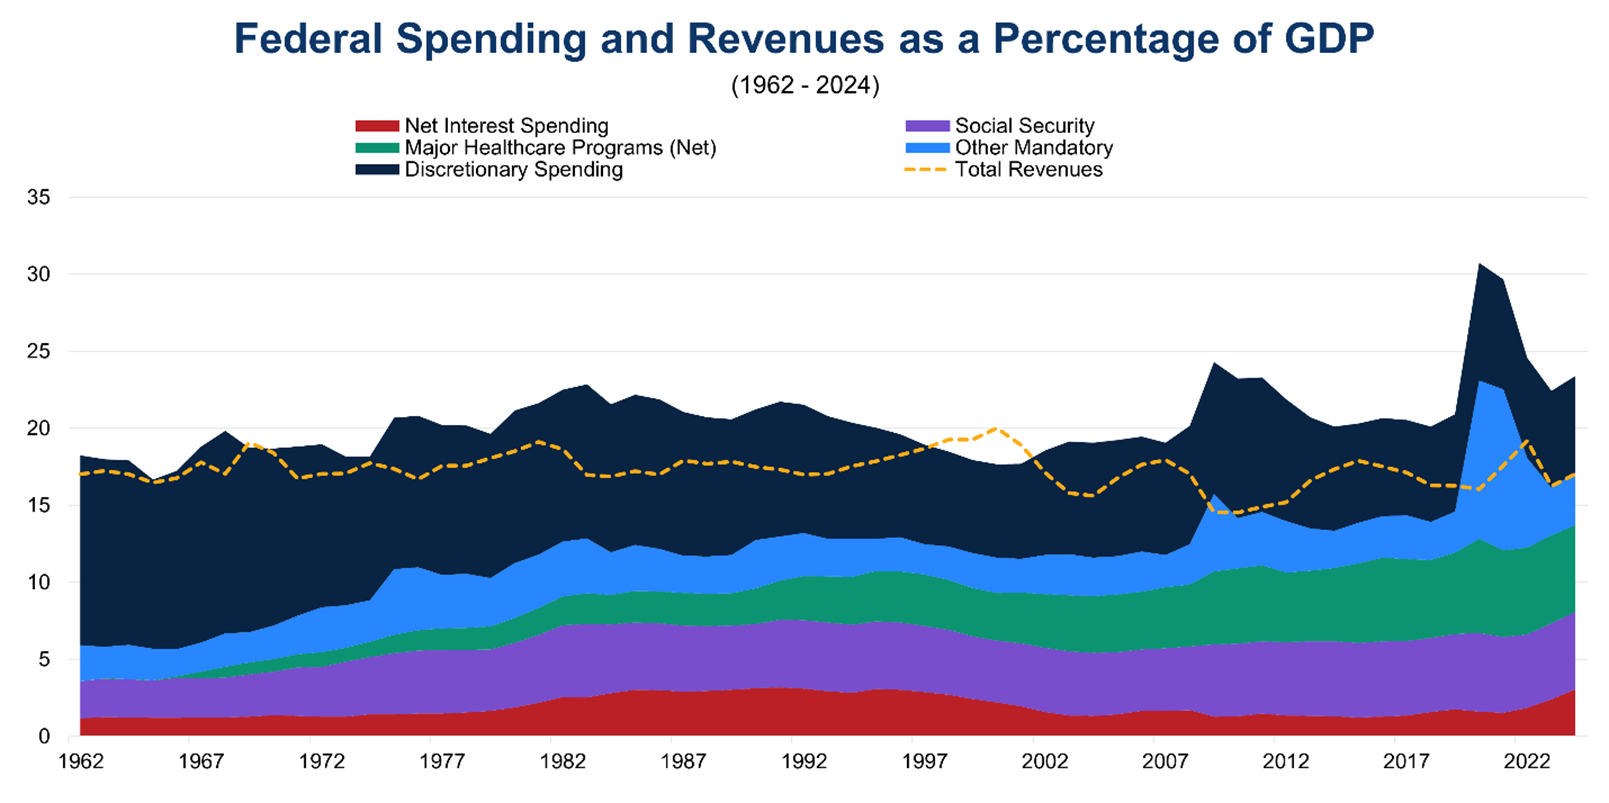
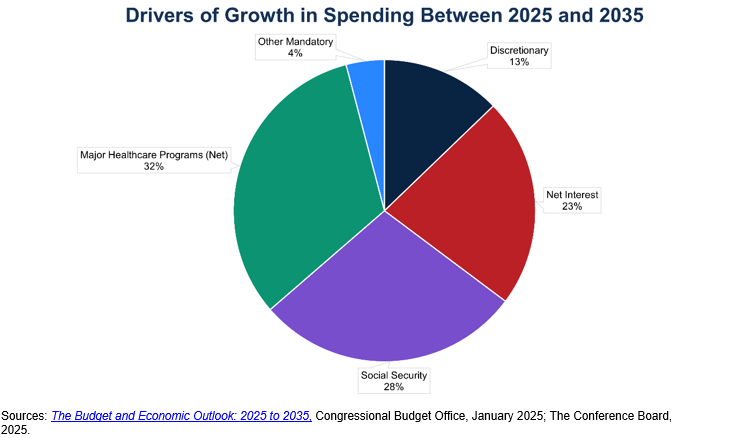
As of the end of July 2025, the total US national debt stands at an excessive $36.7 trillion. For Fiscal Year 2024, the US national budget deficit was $1.9 trillion. The biggest drivers of the national debt are spending on Social Security benefits, major Federal healthcare programs, and net interest on the debt (Figures 1 and 2). As discussed below, both the national debt and the yearly budget deficit have been growing unsustainably in recent years, presenting significant challenges for the Federal government, the economy, and the country.
Figures 1 and 2: Social Security, Healthcare Programs, and Net Interest Spending Are the Major Drivers of Rising National Debt
Who Holds the National Debt?
The Treasury Department, Congressional Budget Office, and economic analysts break down the national debt into two principal categories:
- Debt held by the public consists of all national debt held by a person or entity that is not a US Federal government agency. These investors can include individuals, corporations, state and local governments, Federal Reserve Banks, and foreign governments or foreign investors. Approximately 80 percent of the current national debt is held by the public. Debt held by the public is considered by most experts as the most meaningful measure of debt because it focuses on cash raised in financial markets to support government activities. The Federal Reserve, an independent government agency responsible for executing monetary policy, buys and sells Treasury securities to conduct that policy. The Federal Reserve is the single largest holder of US national debt, although it has begun to scale back its holdings, which increased significantly during the pandemic, as part of its current monetary policy.
- Intragovernmental debt is debt that one part of the US Federal government owes to another part of the Federal government. This situation arises when programs such as Social Security and Medicare collect more money than they spend, leading them to reinvest that excess money in Treasury securities to earn a financial return on the surplus. Intragovernmental debt currently represents roughly 20 percent of the national debt.
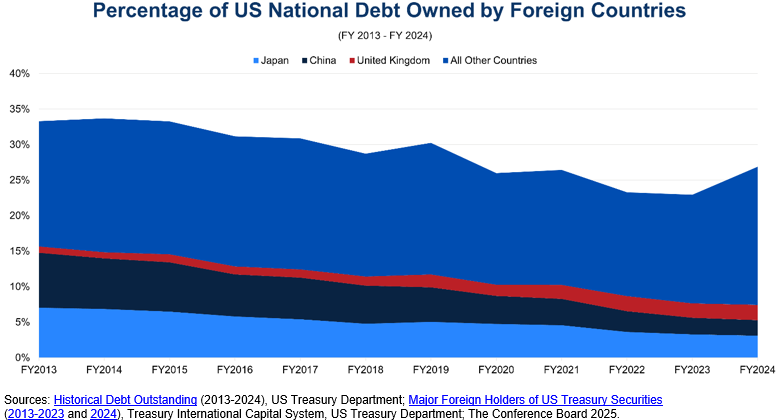
US Treasury debt has traditionally been regarded as a very safe investment, because of the credibility and reliability of the US government to pay its debts. Accordingly, it has been attractive to both US domestic and foreign investors. However, over the last decade, the percentage of the total national debt owned by foreign investors has declined markedly, from about a third of total debt in 2013 to less than one fourth in 2024 (Figure 3). Japan and China, the two largest foreign creditors to the US, have decreased their holdings as a percentage of the total US debt from 15 percent in 2013 to 5 percent in 2024. In dollar terms, Japan’s holdings were $1.2 trillion in 2013 and $1.1 trillion in 2024; China’s were $1.3 trillion in 2013 and $772 billion in 2024.
While some countries including the United Kingdom have proportionally increased their holdings of total US debt, the general trend shows that foreign purchasers have been migrating away from US Treasury securities. Recently, foreign investors from China and other countries have reduced their ownership of US Treasury debts because of short-term capital needs arising from the pandemic and other factors. The total national debt has also risen so quickly in the past 15 years that the supply of US debt may be exceeding foreign demand for US Treasuries, potentially leading to higher interest rates on future debt issued to entice investors. This trend puts a greater burden on domestic investors to fund rising deficits.
Figure 3: Foreign Ownership as a Percentage of US National Debt Has Declined
How to Analyze the National Debt: Debt to GDP Ratio
When analyzing the growing national debt, it is helpful to view it in two ways:
- first, to consider the rapid increases of debt in nominal dollars in recent years;
- second, to examine the debt as a percentage of US gross domestic product (GDP), or the total value of the final goods and services produced within the US each year.
The total US national debt rose from $5.7 trillion in 2000 to $13.6 trillion in 2010 to $26.9 trillion in 2020 to $35.5 trillion in 2024 – an exceptionally rapid increase in a few short years (Figure 4).
Comparing the national debt to GDP (Figure 5) produces a ratio that reveals the United States’ ability to pay down its debt. The debt-to-GDP ratio shows the burden of the national debt relative to the country’s total economic output and can provide greater context than looking at total debt numbers alone. Based on examples from international financial institutions, the recent past, and econometric analysis, CED recommends a public debt-to-GDP ratio of no higher than 70 percent as a stable and sustainable level of debt burden. The European Union requires member states to limit government debt to 60 percent of GDP as a condition for joining the euro, and a World Bank analysis finds 77 percent as the threshold at which debt begins to impede economic growth in developed countries. CED’s recommendation is roughly in the middle of this reference frame.
Higher levels of debt-to-GDP lower economic growth in developed countries and increase the Federal government’s exposure to higher interest rates as US Treasury securities mature and are rolled over into new securities with higher rates. While some advanced economies like Japan have had debt-to-GDP ratios exceeding 100 percent over the past two decades, high savings rates from Japanese households allow the Japanese government to borrow extremely cheaply from Japanese banks. This does not apply in the American context, and high debt has also served as a drag on Japanese growth.
Figure 4: Growth of Total US National Debt Since 2000
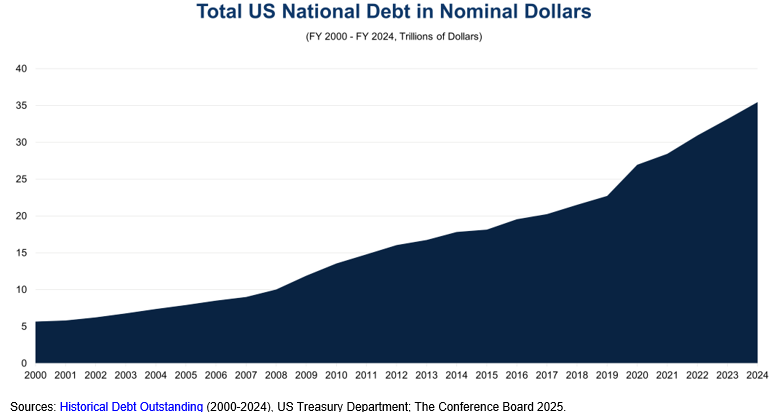
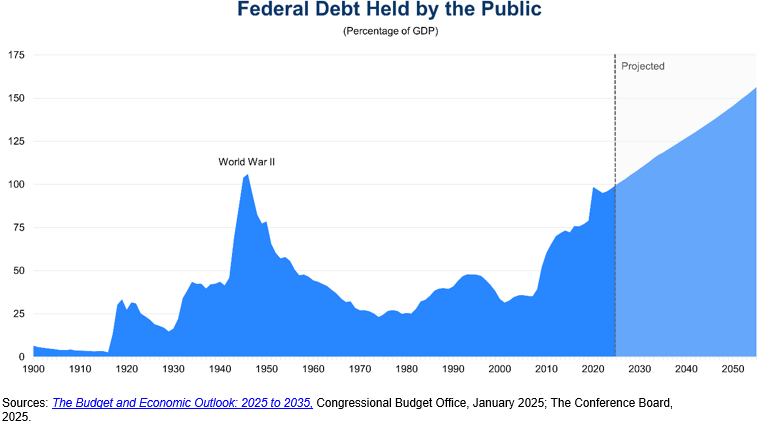
Figure 5: Federal Debt Held by the Public as a Percentage of GDP (1900-2055)
Historical Trends (World War II to Present Day)
The US has always carried a national debt, with the national government incurring debts of approximately $75.5 million after the Revolutionary War. As the first US Treasury Secretary Alexander Hamilton argued, a national debt in and of itself is not a bad thing, and Congress' decision to assume individual state debts after the Revolutionary War allowed the country to consolidate wartime debts and establish the faith and credit of the new US government both at home and abroad. The primary concern with the national debt arises when debt levels become unsustainable and threatens the Federal government’s ability to respond to crises and invest in productive economic projects and activities.
Since 1900, the national debt held by the public has reached two peaks as a percentage of GDP – World War II and the present day – and is forecast to continue growing for the next three decades, reaching 156 percent of GDP by 2055 according to the most recent projections from the Congressional Budget Office.
World War II
During World War II, the Federal government borrowed vast sums of money to sustain the war effort. The debt-to-GDP ratio more than doubled during this time, increasing to over 100 percent for the first time in the nation’s modern history (in dollar terms, total debt was $258.7 billion in 1945). The existential threat to America’s freedom and prosperity justified this rapid increase in the national debt.
Post-War Economic Boom
After the end of World War II, the United States experienced an economic boom as the country emerged as the sole industrial power largely unscathed from the war. American troops came home to work in factories quickly converted from wartime to peacetime production, employing unparalleled new technology. US workers were also flush with savings after wartime shortages and rationing that restricted their spending during the war. These conditions led to strong economic growth, which combined with a massive reduction in defense spending (from 37 percent of GDP in 1945 to less than 5 percent of GDP in 1950) to reduce the debt-to-GDP ratio to manageable levels (51 percent of GDP) by the mid-1950s.
Economic Instability of Late 1960s – Early 1990s
The United States’ favorable economic situation would not last forever. Interest rates and inflation – two measures of economic stability that reflect the cost of borrowing money and general price levels, respectively – began rising in the late 1960s. President Johnson’s “Great Society” programs (including Medicare, Medicaid, Job Corps for the unemployed, Head Start for preschool children, and others) and simultaneously financing the Vietnam War led to the largest budget deficits since World War II and startled financial markets. These deficits continued under President Nixon, combining with the Middle East oil embargo of the 1970s to lead to high levels of inflation threatening the US economic outlook.
After the economic turmoil of the 1970s, President Reagan entered office in 1981 promising to tackle inflation and the budget deficit. While inflation did come down, the Federal government also ran high deficits because of tax cuts and significant increases in military spending that were not matched by cuts in other areas of discretionary or mandatory spending. Nevertheless, economic growth was relatively strong, which tempered the rise of the debt-to-GDP ratio in the 1980s to 39 percent of GDP by 1989.
Era of Balanced Budgets and Surpluses (1990s)
During the Administration of President Clinton, the debt-to-GDP ratio started to decline due to an expanding economy and deficit-reduction policies that President Clinton negotiated with the Republican-controlled Congress at the time. By the end of President Clinton’s second term, the US experienced four consecutive years of budget surpluses, leading the Congressional Budget Office to predict that the US national debt would be paid off completely in the decade of the 2000s under the new fiscal baseline.
Recent History (2001 to Present Day)
At the turn of the 21st century, the Federal Government’s response to geopolitical shocks, most importantly the aftermath of September 11th and the 2008 Great Recession, contributed to the reversal of the budget surpluses the nation inherited. During this time, the debt-to-GDP ratio increased dramatically, nearly doubling from 2007 to 2012 (in dollar terms, the total national debt was $9 trillion in 2007 and $16.1 trillion in 2012). The total debt-to-GDP ratio reached 100 percent in 2013 ($16.7 trillion).
The next noteworthy rise in the debt-to-GDP ratio occurred in response to the COVID-19 pandemic. In 2020 and 2021, Congress enacted six pieces of legislation with a total cost of more than $5.3 trillion to address the public health and economic effects of the pandemic. This massive increase in government spending contributed to an increase in the debt-to-GDP ratio from approximately 80 percent in 2019 ($22.7 trillion) to 97 percent in 2022 ($30.9 trillion). Rising deficits as the country recovered from the pandemic contributed to the debt held by the public reaching nearly 100 percent of GDP in 2023.
After World War II, the US was well positioned to reduce its debt-to-GDP ratio. Now, however, broader underlying trends put the US in a worse position to respond to the extremely sharp rise in the national debt over the past two decades.
Broader Demographic and Economic Trends
Several significant demographic and economic trends are negatively affecting the long-term outlook for the national debt:
- Aging Population: The oversize “Baby Boom” generation that was born after World War II is maturing and has been retiring from the workforce at high rates. These older Americans have been enrolling in Medicare and Social Security, driving up spending on these two crucial programs for the elderly. With proportionally fewer Americans participating in the labor force and paying income and payroll taxes, the gap between spending and revenues is rapidly growing absent decisive action from policymakers. Social Security’s dedicated trust fund is projected to become insolvent and be unable to pay full benefits by 2033, resulting in either an automatic across-the-board benefit cut of 23 percent or a backfill from the general accounts that will further increase deficits and the national debt.
- Rising Health Care Costs: The aging population is also increasing health care costs as elderly Americans live longer and use more health care services. The Medicare population is aging as well (the average age of beneficiaries is rising), multiplying the effect of this demographic trend. Combined with a health care system that is the most expensive in the world on a per-person basis and that suffers from administrative inefficiencies and misaligned incentives, health care costs will continue to rise over the coming decades if the Federal government does not pursue significant reform of the health care system. Medicare’s dedicated trust fund that pays for inpatient and other hospital-related services is also projected to become insolvent in 2033, threatening the availability and timely provision of crucial health care benefits for millions of elderly and disabled Americans who depend on Medicare.
- Rising Costs of Servicing the Debt: The cost of paying interest to investors that own Treasury securities, known as “servicing the debt,” has increased to the point where it is larger than annual military spending. As the Federal government continues to incur budget deficits, the cost of servicing the debt will only grow. Moreover, these interest payments are sensitive to prevailing interest rates in the market. For most of the 21st century, interest rates have been at historically low levels, meaning that shifts back to longer-term averages, as has occurred over the past three years, will have a significant impact on the cost of servicing the debt moving forward.
- Lower Economic Growth and Government Revenues: The labor force (the number of working age adults who are employed or looking for employment) and productivity (how efficiently goods and services are produced) are two important factors that influence economic growth. With the retirement of the Baby Boomers, labor force growth is expected to decline. Without high levels of immigration that bolster the labor force or massive technological breakthroughs that increase productivity, potential economic growth will not reach the levels the United States experienced in the 20th century. The size of the economy directly impacts government revenues because the Federal government taxes economic activity via individual income, payroll, and corporate taxes. Thus, the Federal government will struggle to raise sufficient revenues to cover spending obligations given the declining prospects for strong economic growth.
The chart below shows the effects of these long-term trends on projections of Federal budget spending and revenues over the next three decades. The analysis is an update to CED’s Solutions Brief Dealing With Fiscal Debt: A Policy Road Map from March 2022.
Figure 6: Health Care Spending and the Cost of Servicing the National Debt Drive Increasing Deficits Over the Next Three Decades
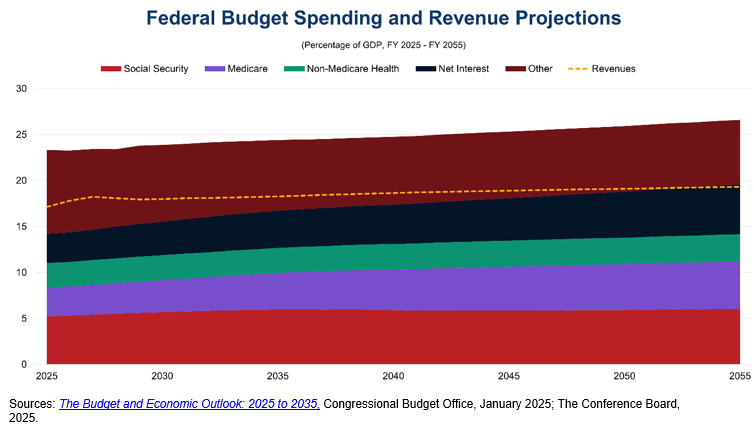
The Congressional Budget Office projects that spending will exceed revenues across the entire forecast period, leading to an increase in the ratio of debt held by the public to GDP from 100 percent in 2025 to 156 percent in 2055.
The biggest drivers of spending increases over the next three decades are healthcare, Social Security, and net interest on the national debt. The table below demonstrates a breakdown of the major spending and revenue categories for 2025 and 2055 (see Figure 7 for another visualization of these trends).
Table 1: Comparison of Spending and Revenue Projections in 2025 and 2055 (Percentage of GDP)
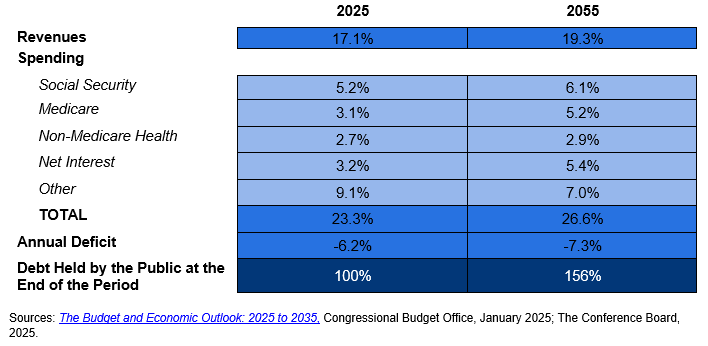
Figure 7: Spending on Social Security and Medicare Drives Increases in National Debt
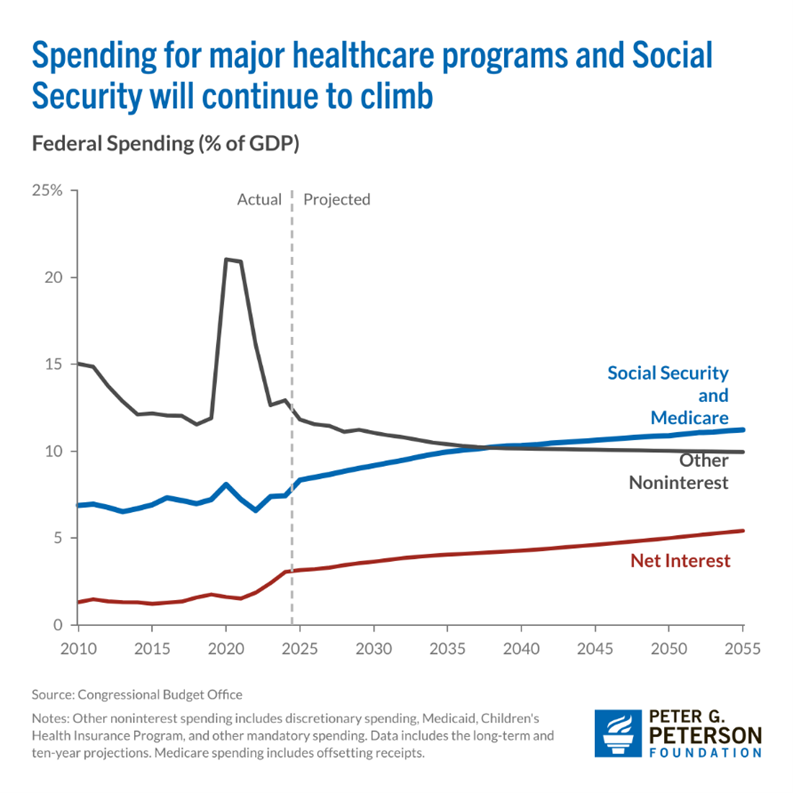
Source: Peter G. Peterson Foundation, 2025.
Impacts of Outsized National Debt
The outsized and unsustainable national debt poses significant challenges to the Federal government, US economy, and society at large, and the costs of inaction are only rising. Fundamentally, high levels of debt increase the cost of servicing the debt, which crowds out other spending priorities for the government, as Figure 6 shows. Revenues will no longer be able to cover our national priorities. All discretionary spending and a portion of non-Medicare health spending will be impacted. The effect is magnified if interest rates remain elevated, as this requires a greater portion of revenues to be used for servicing the debt, forcing a choice between reducing discretionary spending or borrowing even more money – at higher rates – to cover that spending.
As the national debt continues its unsustainable path, financial markets and foreign lenders will lose confidence in the Federal government’s ability to pay back the debt, especially given long-term demographic and economic trends associated with the status quo. This loss of confidence has multiple important effects, particularly on the Federal government’s credit rating, the higher interest rates that the US Treasury must pay investors to compensate for the greater risk of default, and the value of the US dollar as investors seek safer investments. Higher interest rates could even create a “spiral” or “feedback loop” where the cost of servicing the debt increases, leading to higher interest rates and further higher costs to service the debt.
Some of these effects have already occurred, with all three major credit agencies downgrading their outlook and credit ratings for the US. Confidence in a government’s ability to pay back debt can also unravel quickly, as the experience of the United Kingdom in October 2022 revealed. After UK Prime Minister Liz Truss unveiled a “mini-budget” with some of the largest tax cuts in decades that were primarily financed via deficit spending, financial markets were rattled, causing precipitous declines in the value of the pound and threatening the solvency of British pension funds. In a matter of weeks, Prime Minister Truss and Chancellor of the Exchequer Kwasi Kwarteng were forced to resign as a result of the backlash.
For the private sector, government issuing more Treasury securities also reduces investment as financial markets redirect capital to purchasing US debt. Additionally, the Federal government will have reduced flexibility to quickly address geopolitical events and global shocks that can happen at any time, such as national security crises and the impacts of climate change. Combined with a loss of confidence in the Federal government’s ability to pay back the national debt, confidence in the dollar could weaken, inhibiting economic growth and driving higher rates of inflation. All Americans will feel the effects of these hardships, with the national debt preventing us from investing in America’s future.
CED Recommendations to Address Debt Crisis
Recent polling of American attitudes towards the national debt reveals that the public is growing increasingly concerned about our nation’s unsustainable fiscal path. In a March 2023 Gallup poll, 52 percent of Americans said they personally worried “a great deal” about federal spending and the budget deficit. Polling from the Pew Research Center in January 2023 also showed that 57 percent of Americans believe reducing the budget deficit should be a top priority for the president and Congress to address. This figure increased by 12 percentage points from a year before.
These concerns about the national debt and deficits extend to business leaders, as US CEOs ranked the US national debt and deficits as the number-one economy-related geopolitical risk for their business operations in 2025 according to The Conference Board’s C-Suite Outlook 2025: Seizing the Future.
The increased concern from the public and business executives regarding the national debt presents an opportunity for Congress to act to address the Debt Crisis. CED has laid out its recommendations to achieve fiscal stability, including a strategic objective to reduce the US debt-to-GDP ratio to 70 percent, and immediately addressing the major drivers of the debt:
- Establish a Strategic Objective of Reducing the Debt to GDP ratio to 70 percent: Policy makers in Congress and the Executive Branch should set a fiscally responsible strategic goal of reducing public debt to 70 percent of GDP within a timeframe of 20 years, which will allow the goal to be achieved without causing major economic disruption and hardship.
- Start Now to Address the Largest Drivers of Debt: Most immediately, to start the US on that pathway, policy leaders must immediately begin to prioritize fiscal restraint across the entire federal budget including mandatory and discretionary spending. This approach includes addressing two of the major drivers of that debt (Social Security and Medicare/healthcare) and also pursuing comprehensive tax reform. It will also serve as an opportunity to raise public awareness of and support for reforms. The commission should include current members of Congress, have strict timelines, and consider all drivers of the debt, including mandatory spending and revenues. Business and the public back this idea. 87 percent of CED Trustee CEOs and Board Directors believe a bipartisan commission could help reduce the national debt, and 92 percent of voters are more likely to support a candidate who backs a fiscal commission.
- Save Social Security: To avert the insolvency of the Social Security Trust Fund and preserve these vital benefits, policy leaders and business leaders should develop a comprehensive reform package with benefit adjustments and protections for vulnerable populations of retirees (see Figure 9 for more details).
- Reform Medicare: Reforming Medicare is a necessary condition for regaining fiscal health, particularly in light of the projected insolvency of Medicare’s Hospital Insurance Trust Fund. CED recommendations include putting more consumer choice into healthcare, eliminating the Medicare Advantage price “benchmark,” gradually raising the age of eligibility, and restricting states’ use of provider taxes.
- Enact Comprehensive Tax Reform: Historically, comprehensive tax reform (different from simply changing rates) has proven to be the best way to increase revenues and should be guided by the principles of fairness, efficiency, and simplicity.
- Establishing a Bipartisan Congressional Committee on Fiscal Responsibility: A bipartisan Congressional commission on achieving fiscal stability will aim for the strategic goal of reducing public debt to 70 percent of GDP within a defined timeframe (such as 20 years) and will serve as an opportunity to raise public awareness and support for reforms. The commission should include current members of Congress, have strict timelines, and consider all drivers of the debt, including both mandatory and discretionary spending. Business leaders and the public back this idea, with 87 percent of CED Trustee CEOs and Board Directors believing a bipartisan commission could help reduce the national debt, and 92 percent of voters being more likely to support a candidate who backs a fiscal commission.
(Figures 8 and 9 below give the situations as they were in 2022 at the time CED released its Solutions Brief; the figures are worse now, adding to the urgency to act quickly.)
Figure 8: CED’s Road Map for Reducing Public Debt to GDP to 70 percent
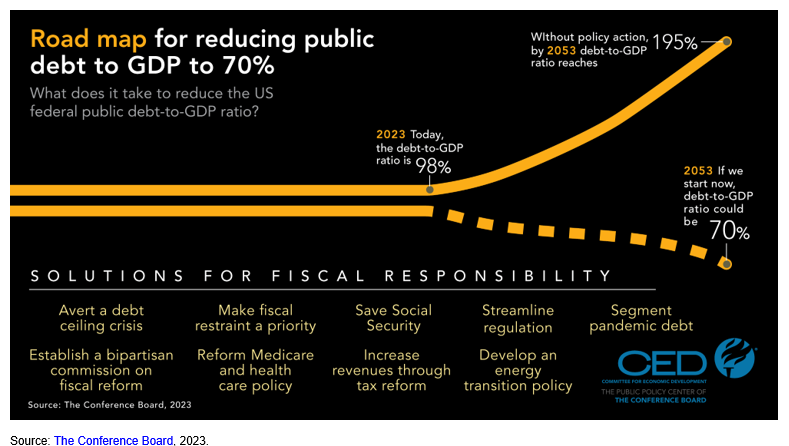
Figure 9: Social Security Trust Fund Insolvency and CED Recommendations to Save Social Security

Conclusion
The national debt is a crisis that will only continue to grow if left unaddressed, demanding the attention of policymakers and the public. While long-term demographic trends, including the aging population, are challenging to reverse, the Federal government can take many meaningful steps to save Social Security, modernize Medicare, and establish a bipartisan Congressional commission to make addressing the national debt a central issue. Action must be taken now to begin turning the tide on the rising national debt and preserve prosperity for future generations of Americans.
For further reading
- CED’s Solutions Brief, Debt Matters: A Road Map for Reducing the Outsized US Debt Burden, February 2023.
- CED’s Solutions Brief Saving Social Security, February 2024.
- CED’s Solutions Brief, Modernizing Health Programs for Fiscal Sustainability and Quality, November 2024.
- CED’s Explainer, Social Security, August 2025.
- CED’s Explainer, Medicare, August 2025.
- CED’s Explainer, Medicaid, August 2025.
- “The Debt Crisis is Here,” Dana M. Peterson and Lori Esposito Murray, November 13, 2023.
Trusted Insights for What’s Ahead®
The Debt Crisis is here – the US national debt, the amount of money that the Treasury has borrowed and not yet repaid to meet its spending obligations, recently reached a record $36.7 trillion. Government spending also exceeded government revenues by $1.9 trillion in Fiscal Year 2024. Combined with rising costs to service the national debt and the impending insolvency of the Social Security and Medicare trust funds over the next decade, the US faces a challenging fiscal outlook that will only continue to worsen absent immediate action from federal policymakers.
This explainer provides an overview of the national debt; historical, demographic, and economic trends that have influenced the debt’s growth; and the impact of the outsized levels of national debt on the Federal government and the economy, along with CED’s recommendations to address the Debt Crisis.
- Annual budget deficits lead the Federal government to borrow money to cover the gap between spending and revenues, increasing the national debt.
- Most of the national debt is held by domestic and foreign investors (“the public”), though foreign ownership of the debt as a percentage of the total debt has declined in the past decade.
- The broader trends of an aging population, rising health care costs, rising costs of servicing the debt, and lower economic growth and government revenues are the primary drivers of the rising national debt.
- In the 21st century, the national debt has increased significantly because of government responses to major events including the September 11 terror attacks, the Great Recession of 2008, and the COVID-19 pandemic, highlighting the need for a sustainable level of national debt to be able to respond to future geopolitical crises.
- The Debt Crisis is here. The outsized and unsustainable national debt poses significant challenges to the Federal government, US economy, and society at large, and the costs of inaction are only rising. The servicing of the outsized national debt will crowd out other national priorities and may cause a loss of confidence in the Federal government’s ability to repay the debt. This will have adverse impacts on the economy, particularly on the Federal government’s credit rating, the higher interest rates that the US Treasury must pay investors to compensate for the greater risk of default, and the value of the US dollar as investors seek safer investments.
- Consequently, given the size and breadth of the US economy and the US global leadership role, both global security and economic stability and growth will be adversely impacted.
- The cost of servicing the national debt is also projected to grow to historic levels over the next decade because of higher spending and higher interest rates, which makes financing additional debt more expensive and further exacerbates the Debt Crisis.
- The debt-to-GDP ratio shows the burden of the national debt relative to the country’s total economic output and reveals the United States’ ability to pay down its debt. Public debt stands today at its highest level since World War II – 100 percent – and is projected to grow even higher in the next decade. Based on examples from international financial institutions, the recent past, and econometric analysis, CED recommends a public debt-to-GDP ratio of no higher than 70 percent, still high historically – but a more stable and sustainable level of debt burden. To get down to this debt ratio will take time. We must start taking action now.
What Is the National Debt?
The Treasury Department defines the US national debt as the amount of money the Federal government has borrowed to cover the outstanding balance of expenses incurred over time. The budget deficit results from government spending exceeding the revenue the government collects in a given fiscal year, and the Federal government must sell Treasury securities to borrow money and cover the amount of spending that exceeds revenues. The national debt is thus the total accumulated borrowing from selling Treasury securities over the course of the nation’s history that has not yet been repaid.
Given the relation of the Federal government’s annual budget to the national debt, it is important to understand the major components of the Federal budget:
- Mandatory spending is spending required by law that falls outside the regular Congressional appropriations process because the relevant laws mandate this spending based on statutory formulas. This principally includes funds for Social Security benefits and healthcare, which includes a significant portion of Medicare and the Federal share of Medicaid (a joint Federal-state program). In Fiscal Year 2024, Social Security benefits comprised 32 percent of mandatory spending and the major Federal healthcare programs were 41 percent of mandatory spending. It also includes some income security programs such as the Supplemental Nutrition Assistance Program (SNAP), student loan programs, and some veterans’ programs. Mandatory spending is the largest share of government spending, accounting for about two-thirds of total spending. Congress reserves the right to change the conditions under which mandatory spending programs operate.
- Discretionary spending is subject to annual appropriations set by Congress. The 12 appropriations bills fund all other government programs for major US national priorities, including national defense, infrastructure, transportation, education, housing, and social service programs.
- Net interest spending is money that the Federal government pays to investors that own Treasury securities. Interest payments on the national debt are a type of mandatory spending to compensate investors for buying US debt – otherwise, the government would default on its obligations – and have been growing recently as a proportion of the Federal budget because of rising deficits and interest rates. In Fiscal Year 2024, net interest spending was $881 billion and comprised 13 percent of total Federal government spending. The Congressional Budget Office projects net interest spending to grow to $1.8 trillion in 2035, representing 17 percent of total government spending and equal to 4.1 percent of GDP.
- Revenues are money that the Federal government collects to fund all the spending listed above. The primary sources of Federal revenues are individual income taxes, payroll taxes that fund Social Security and Medicare, and taxes on corporate income.
As of the end of July 2025, the total US national debt stands at an excessive $36.7 trillion. For Fiscal Year 2024, the US national budget deficit was $1.9 trillion. The biggest drivers of the national debt are spending on Social Security benefits, major Federal healthcare programs, and net interest on the debt (Figures 1 and 2). As discussed below, both the national debt and the yearly budget deficit have been growing unsustainably in recent years, presenting significant challenges for the Federal government, the economy, and the country.
Figures 1 and 2: Social Security, Healthcare Programs, and Net Interest Spending Are the Major Drivers of Rising National Debt
Who Holds the National Debt?
The Treasury Department, Congressional Budget Office, and economic analysts break down the national debt into two principal categories:
- Debt held by the public consists of all national debt held by a person or entity that is not a US Federal government agency. These investors can include individuals, corporations, state and local governments, Federal Reserve Banks, and foreign governments or foreign investors. Approximately 80 percent of the current national debt is held by the public. Debt held by the public is considered by most experts as the most meaningful measure of debt because it focuses on cash raised in financial markets to support government activities. The Federal Reserve, an independent government agency responsible for executing monetary policy, buys and sells Treasury securities to conduct that policy. The Federal Reserve is the single largest holder of US national debt, although it has begun to scale back its holdings, which increased significantly during the pandemic, as part of its current monetary policy.
- Intragovernmental debt is debt that one part of the US Federal government owes to another part of the Federal government. This situation arises when programs such as Social Security and Medicare collect more money than they spend, leading them to reinvest that excess money in Treasury securities to earn a financial return on the surplus. Intragovernmental debt currently represents roughly 20 percent of the national debt.
US Treasury debt has traditionally been regarded as a very safe investment, because of the credibility and reliability of the US government to pay its debts. Accordingly, it has been attractive to both US domestic and foreign investors. However, over the last decade, the percentage of the total national debt owned by foreign investors has declined markedly, from about a third of total debt in 2013 to less than one fourth in 2024 (Figure 3). Japan and China, the two largest foreign creditors to the US, have decreased their holdings as a percentage of the total US debt from 15 percent in 2013 to 5 percent in 2024. In dollar terms, Japan’s holdings were $1.2 trillion in 2013 and $1.1 trillion in 2024; China’s were $1.3 trillion in 2013 and $772 billion in 2024.
While some countries including the United Kingdom have proportionally increased their holdings of total US debt, the general trend shows that foreign purchasers have been migrating away from US Treasury securities. Recently, foreign investors from China and other countries have reduced their ownership of US Treasury debts because of short-term capital needs arising from the pandemic and other factors. The total national debt has also risen so quickly in the past 15 years that the supply of US debt may be exceeding foreign demand for US Treasuries, potentially leading to higher interest rates on future debt issued to entice investors. This trend puts a greater burden on domestic investors to fund rising deficits.
Figure 3: Foreign Ownership as a Percentage of US National Debt Has Declined
How to Analyze the National Debt: Debt to GDP Ratio
When analyzing the growing national debt, it is helpful to view it in two ways:
- first, to consider the rapid increases of debt in nominal dollars in recent years;
- second, to examine the debt as a percentage of US gross domestic product (GDP), or the total value of the final goods and services produced within the US each year.
The total US national debt rose from $5.7 trillion in 2000 to $13.6 trillion in 2010 to $26.9 trillion in 2020 to $35.5 trillion in 2024 – an exceptionally rapid increase in a few short years (Figure 4).
Comparing the national debt to GDP (Figure 5) produces a ratio that reveals the United States’ ability to pay down its debt. The debt-to-GDP ratio shows the burden of the national debt relative to the country’s total economic output and can provide greater context than looking at total debt numbers alone. Based on examples from international financial institutions, the recent past, and econometric analysis, CED recommends a public debt-to-GDP ratio of no higher than 70 percent as a stable and sustainable level of debt burden. The European Union requires member states to limit government debt to 60 percent of GDP as a condition for joining the euro, and a World Bank analysis finds 77 percent as the threshold at which debt begins to impede economic growth in developed countries. CED’s recommendation is roughly in the middle of this reference frame.
Higher levels of debt-to-GDP lower economic growth in developed countries and increase the Federal government’s exposure to higher interest rates as US Treasury securities mature and are rolled over into new securities with higher rates. While some advanced economies like Japan have had debt-to-GDP ratios exceeding 100 percent over the past two decades, high savings rates from Japanese households allow the Japanese government to borrow extremely cheaply from Japanese banks. This does not apply in the American context, and high debt has also served as a drag on Japanese growth.
Figure 4: Growth of Total US National Debt Since 2000
Figure 5: Federal Debt Held by the Public as a Percentage of GDP (1900-2055)
Historical Trends (World War II to Present Day)
The US has always carried a national debt, with the national government incurring debts of approximately $75.5 million after the Revolutionary War. As the first US Treasury Secretary Alexander Hamilton argued, a national debt in and of itself is not a bad thing, and Congress' decision to assume individual state debts after the Revolutionary War allowed the country to consolidate wartime debts and establish the faith and credit of the new US government both at home and abroad. The primary concern with the national debt arises when debt levels become unsustainable and threatens the Federal government’s ability to respond to crises and invest in productive economic projects and activities.
Since 1900, the national debt held by the public has reached two peaks as a percentage of GDP – World War II and the present day – and is forecast to continue growing for the next three decades, reaching 156 percent of GDP by 2055 according to the most recent projections from the Congressional Budget Office.
World War II
During World War II, the Federal government borrowed vast sums of money to sustain the war effort. The debt-to-GDP ratio more than doubled during this time, increasing to over 100 percent for the first time in the nation’s modern history (in dollar terms, total debt was $258.7 billion in 1945). The existential threat to America’s freedom and prosperity justified this rapid increase in the national debt.
Post-War Economic Boom
After the end of World War II, the United States experienced an economic boom as the country emerged as the sole industrial power largely unscathed from the war. American troops came home to work in factories quickly converted from wartime to peacetime production, employing unparalleled new technology. US workers were also flush with savings after wartime shortages and rationing that restricted their spending during the war. These conditions led to strong economic growth, which combined with a massive reduction in defense spending (from 37 percent of GDP in 1945 to less than 5 percent of GDP in 1950) to reduce the debt-to-GDP ratio to manageable levels (51 percent of GDP) by the mid-1950s.
Economic Instability of Late 1960s – Early 1990s
The United States’ favorable economic situation would not last forever. Interest rates and inflation – two measures of economic stability that reflect the cost of borrowing money and general price levels, respectively – began rising in the late 1960s. President Johnson’s “Great Society” programs (including Medicare, Medicaid, Job Corps for the unemployed, Head Start for preschool children, and others) and simultaneously financing the Vietnam War led to the largest budget deficits since World War II and startled financial markets. These deficits continued under President Nixon, combining with the Middle East oil embargo of the 1970s to lead to high levels of inflation threatening the US economic outlook.
After the economic turmoil of the 1970s, President Reagan entered office in 1981 promising to tackle inflation and the budget deficit. While inflation did come down, the Federal government also ran high deficits because of tax cuts and significant increases in military spending that were not matched by cuts in other areas of discretionary or mandatory spending. Nevertheless, economic growth was relatively strong, which tempered the rise of the debt-to-GDP ratio in the 1980s to 39 percent of GDP by 1989.
Era of Balanced Budgets and Surpluses (1990s)
During the Administration of President Clinton, the debt-to-GDP ratio started to decline due to an expanding economy and deficit-reduction policies that President Clinton negotiated with the Republican-controlled Congress at the time. By the end of President Clinton’s second term, the US experienced four consecutive years of budget surpluses, leading the Congressional Budget Office to predict that the US national debt would be paid off completely in the decade of the 2000s under the new fiscal baseline.
Recent History (2001 to Present Day)
At the turn of the 21st century, the Federal Government’s response to geopolitical shocks, most importantly the aftermath of September 11th and the 2008 Great Recession, contributed to the reversal of the budget surpluses the nation inherited. During this time, the debt-to-GDP ratio increased dramatically, nearly doubling from 2007 to 2012 (in dollar terms, the total national debt was $9 trillion in 2007 and $16.1 trillion in 2012). The total debt-to-GDP ratio reached 100 percent in 2013 ($16.7 trillion).
The next noteworthy rise in the debt-to-GDP ratio occurred in response to the COVID-19 pandemic. In 2020 and 2021, Congress enacted six pieces of legislation with a total cost of more than $5.3 trillion to address the public health and economic effects of the pandemic. This massive increase in government spending contributed to an increase in the debt-to-GDP ratio from approximately 80 percent in 2019 ($22.7 trillion) to 97 percent in 2022 ($30.9 trillion). Rising deficits as the country recovered from the pandemic contributed to the debt held by the public reaching nearly 100 percent of GDP in 2023.
After World War II, the US was well positioned to reduce its debt-to-GDP ratio. Now, however, broader underlying trends put the US in a worse position to respond to the extremely sharp rise in the national debt over the past two decades.
Broader Demographic and Economic Trends
Several significant demographic and economic trends are negatively affecting the long-term outlook for the national debt:
- Aging Population: The oversize “Baby Boom” generation that was born after World War II is maturing and has been retiring from the workforce at high rates. These older Americans have been enrolling in Medicare and Social Security, driving up spending on these two crucial programs for the elderly. With proportionally fewer Americans participating in the labor force and paying income and payroll taxes, the gap between spending and revenues is rapidly growing absent decisive action from policymakers. Social Security’s dedicated trust fund is projected to become insolvent and be unable to pay full benefits by 2033, resulting in either an automatic across-the-board benefit cut of 23 percent or a backfill from the general accounts that will further increase deficits and the national debt.
- Rising Health Care Costs: The aging population is also increasing health care costs as elderly Americans live longer and use more health care services. The Medicare population is aging as well (the average age of beneficiaries is rising), multiplying the effect of this demographic trend. Combined with a health care system that is the most expensive in the world on a per-person basis and that suffers from administrative inefficiencies and misaligned incentives, health care costs will continue to rise over the coming decades if the Federal government does not pursue significant reform of the health care system. Medicare’s dedicated trust fund that pays for inpatient and other hospital-related services is also projected to become insolvent in 2033, threatening the availability and timely provision of crucial health care benefits for millions of elderly and disabled Americans who depend on Medicare.
- Rising Costs of Servicing the Debt: The cost of paying interest to investors that own Treasury securities, known as “servicing the debt,” has increased to the point where it is larger than annual military spending. As the Federal government continues to incur budget deficits, the cost of servicing the debt will only grow. Moreover, these interest payments are sensitive to prevailing interest rates in the market. For most of the 21st century, interest rates have been at historically low levels, meaning that shifts back to longer-term averages, as has occurred over the past three years, will have a significant impact on the cost of servicing the debt moving forward.
- Lower Economic Growth and Government Revenues: The labor force (the number of working age adults who are employed or looking for employment) and productivity (how efficiently goods and services are produced) are two important factors that influence economic growth. With the retirement of the Baby Boomers, labor force growth is expected to decline. Without high levels of immigration that bolster the labor force or massive technological breakthroughs that increase productivity, potential economic growth will not reach the levels the United States experienced in the 20th century. The size of the economy directly impacts government revenues because the Federal government taxes economic activity via individual income, payroll, and corporate taxes. Thus, the Federal government will struggle to raise sufficient revenues to cover spending obligations given the declining prospects for strong economic growth.
The chart below shows the effects of these long-term trends on projections of Federal budget spending and revenues over the next three decades. The analysis is an update to CED’s Solutions Brief Dealing With Fiscal Debt: A Policy Road Map from March 2022.
Figure 6: Health Care Spending and the Cost of Servicing the National Debt Drive Increasing Deficits Over the Next Three Decades
The Congressional Budget Office projects that spending will exceed revenues across the entire forecast period, leading to an increase in the ratio of debt held by the public to GDP from 100 percent in 2025 to 156 percent in 2055.
The biggest drivers of spending increases over the next three decades are healthcare, Social Security, and net interest on the national debt. The table below demonstrates a breakdown of the major spending and revenue categories for 2025 and 2055 (see Figure 7 for another visualization of these trends).
Table 1: Comparison of Spending and Revenue Projections in 2025 and 2055 (Percentage of GDP)
Figure 7: Spending on Social Security and Medicare Drives Increases in National Debt
Source: Peter G. Peterson Foundation, 2025.
Impacts of Outsized National Debt
The outsized and unsustainable national debt poses significant challenges to the Federal government, US economy, and society at large, and the costs of inaction are only rising. Fundamentally, high levels of debt increase the cost of servicing the debt, which crowds out other spending priorities for the government, as Figure 6 shows. Revenues will no longer be able to cover our national priorities. All discretionary spending and a portion of non-Medicare health spending will be impacted. The effect is magnified if interest rates remain elevated, as this requires a greater portion of revenues to be used for servicing the debt, forcing a choice between reducing discretionary spending or borrowing even more money – at higher rates – to cover that spending.
As the national debt continues its unsustainable path, financial markets and foreign lenders will lose confidence in the Federal government’s ability to pay back the debt, especially given long-term demographic and economic trends associated with the status quo. This loss of confidence has multiple important effects, particularly on the Federal government’s credit rating, the higher interest rates that the US Treasury must pay investors to compensate for the greater risk of default, and the value of the US dollar as investors seek safer investments. Higher interest rates could even create a “spiral” or “feedback loop” where the cost of servicing the debt increases, leading to higher interest rates and further higher costs to service the debt.
Some of these effects have already occurred, with all three major credit agencies downgrading their outlook and credit ratings for the US. Confidence in a government’s ability to pay back debt can also unravel quickly, as the experience of the United Kingdom in October 2022 revealed. After UK Prime Minister Liz Truss unveiled a “mini-budget” with some of the largest tax cuts in decades that were primarily financed via deficit spending, financial markets were rattled, causing precipitous declines in the value of the pound and threatening the solvency of British pension funds. In a matter of weeks, Prime Minister Truss and Chancellor of the Exchequer Kwasi Kwarteng were forced to resign as a result of the backlash.
For the private sector, government issuing more Treasury securities also reduces investment as financial markets redirect capital to purchasing US debt. Additionally, the Federal government will have reduced flexibility to quickly address geopolitical events and global shocks that can happen at any time, such as national security crises and the impacts of climate change. Combined with a loss of confidence in the Federal government’s ability to pay back the national debt, confidence in the dollar could weaken, inhibiting economic growth and driving higher rates of inflation. All Americans will feel the effects of these hardships, with the national debt preventing us from investing in America’s future.
CED Recommendations to Address Debt Crisis
Recent polling of American attitudes towards the national debt reveals that the public is growing increasingly concerned about our nation’s unsustainable fiscal path. In a March 2023 Gallup poll, 52 percent of Americans said they personally worried “a great deal” about federal spending and the budget deficit. Polling from the Pew Research Center in January 2023 also showed that 57 percent of Americans believe reducing the budget deficit should be a top priority for the president and Congress to address. This figure increased by 12 percentage points from a year before.
These concerns about the national debt and deficits extend to business leaders, as US CEOs ranked the US national debt and deficits as the number-one economy-related geopolitical risk for their business operations in 2025 according to The Conference Board’s C-Suite Outlook 2025: Seizing the Future.
The increased concern from the public and business executives regarding the national debt presents an opportunity for Congress to act to address the Debt Crisis. CED has laid out its recommendations to achieve fiscal stability, including a strategic objective to reduce the US debt-to-GDP ratio to 70 percent, and immediately addressing the major drivers of the debt:
- Establish a Strategic Objective of Reducing the Debt to GDP ratio to 70 percent: Policy makers in Congress and the Executive Branch should set a fiscally responsible strategic goal of reducing public debt to 70 percent of GDP within a timeframe of 20 years, which will allow the goal to be achieved without causing major economic disruption and hardship.
- Start Now to Address the Largest Drivers of Debt: Most immediately, to start the US on that pathway, policy leaders must immediately begin to prioritize fiscal restraint across the entire federal budget including mandatory and discretionary spending. This approach includes addressing two of the major drivers of that debt (Social Security and Medicare/healthcare) and also pursuing comprehensive tax reform. It will also serve as an opportunity to raise public awareness of and support for reforms. The commission should include current members of Congress, have strict timelines, and consider all drivers of the debt, including mandatory spending and revenues. Business and the public back this idea. 87 percent of CED Trustee CEOs and Board Directors believe a bipartisan commission could help reduce the national debt, and 92 percent of voters are more likely to support a candidate who backs a fiscal commission.
- Save Social Security: To avert the insolvency of the Social Security Trust Fund and preserve these vital benefits, policy leaders and business leaders should develop a comprehensive reform package with benefit adjustments and protections for vulnerable populations of retirees (see Figure 9 for more details).
- Reform Medicare: Reforming Medicare is a necessary condition for regaining fiscal health, particularly in light of the projected insolvency of Medicare’s Hospital Insurance Trust Fund. CED recommendations include putting more consumer choice into healthcare, eliminating the Medicare Advantage price “benchmark,” gradually raising the age of eligibility, and restricting states’ use of provider taxes.
- Enact Comprehensive Tax Reform: Historically, comprehensive tax reform (different from simply changing rates) has proven to be the best way to increase revenues and should be guided by the principles of fairness, efficiency, and simplicity.
- Establishing a Bipartisan Congressional Committee on Fiscal Responsibility: A bipartisan Congressional commission on achieving fiscal stability will aim for the strategic goal of reducing public debt to 70 percent of GDP within a defined timeframe (such as 20 years) and will serve as an opportunity to raise public awareness and support for reforms. The commission should include current members of Congress, have strict timelines, and consider all drivers of the debt, including both mandatory and discretionary spending. Business leaders and the public back this idea, with 87 percent of CED Trustee CEOs and Board Directors believing a bipartisan commission could help reduce the national debt, and 92 percent of voters being more likely to support a candidate who backs a fiscal commission.
(Figures 8 and 9 below give the situations as they were in 2022 at the time CED released its Solutions Brief; the figures are worse now, adding to the urgency to act quickly.)
Figure 8: CED’s Road Map for Reducing Public Debt to GDP to 70 percent
Figure 9: Social Security Trust Fund Insolvency and CED Recommendations to Save Social Security
Conclusion
The national debt is a crisis that will only continue to grow if left unaddressed, demanding the attention of policymakers and the public. While long-term demographic trends, including the aging population, are challenging to reverse, the Federal government can take many meaningful steps to save Social Security, modernize Medicare, and establish a bipartisan Congressional commission to make addressing the national debt a central issue. Action must be taken now to begin turning the tide on the rising national debt and preserve prosperity for future generations of Americans.
For further reading
- CED’s Solutions Brief, Debt Matters: A Road Map for Reducing the Outsized US Debt Burden, February 2023.
- CED’s Solutions Brief Saving Social Security, February 2024.
- CED’s Solutions Brief, Modernizing Health Programs for Fiscal Sustainability and Quality, November 2024.
- CED’s Explainer, Social Security, August 2025.
- CED’s Explainer, Medicare, August 2025.
- CED’s Explainer, Medicaid, August 2025.
- “The Debt Crisis is Here,” Dana M. Peterson and Lori Esposito Murray, November 13, 2023.