


International Comparisons of Hourly Compensation Costs in Manufacturing, 2013
17 December 2014
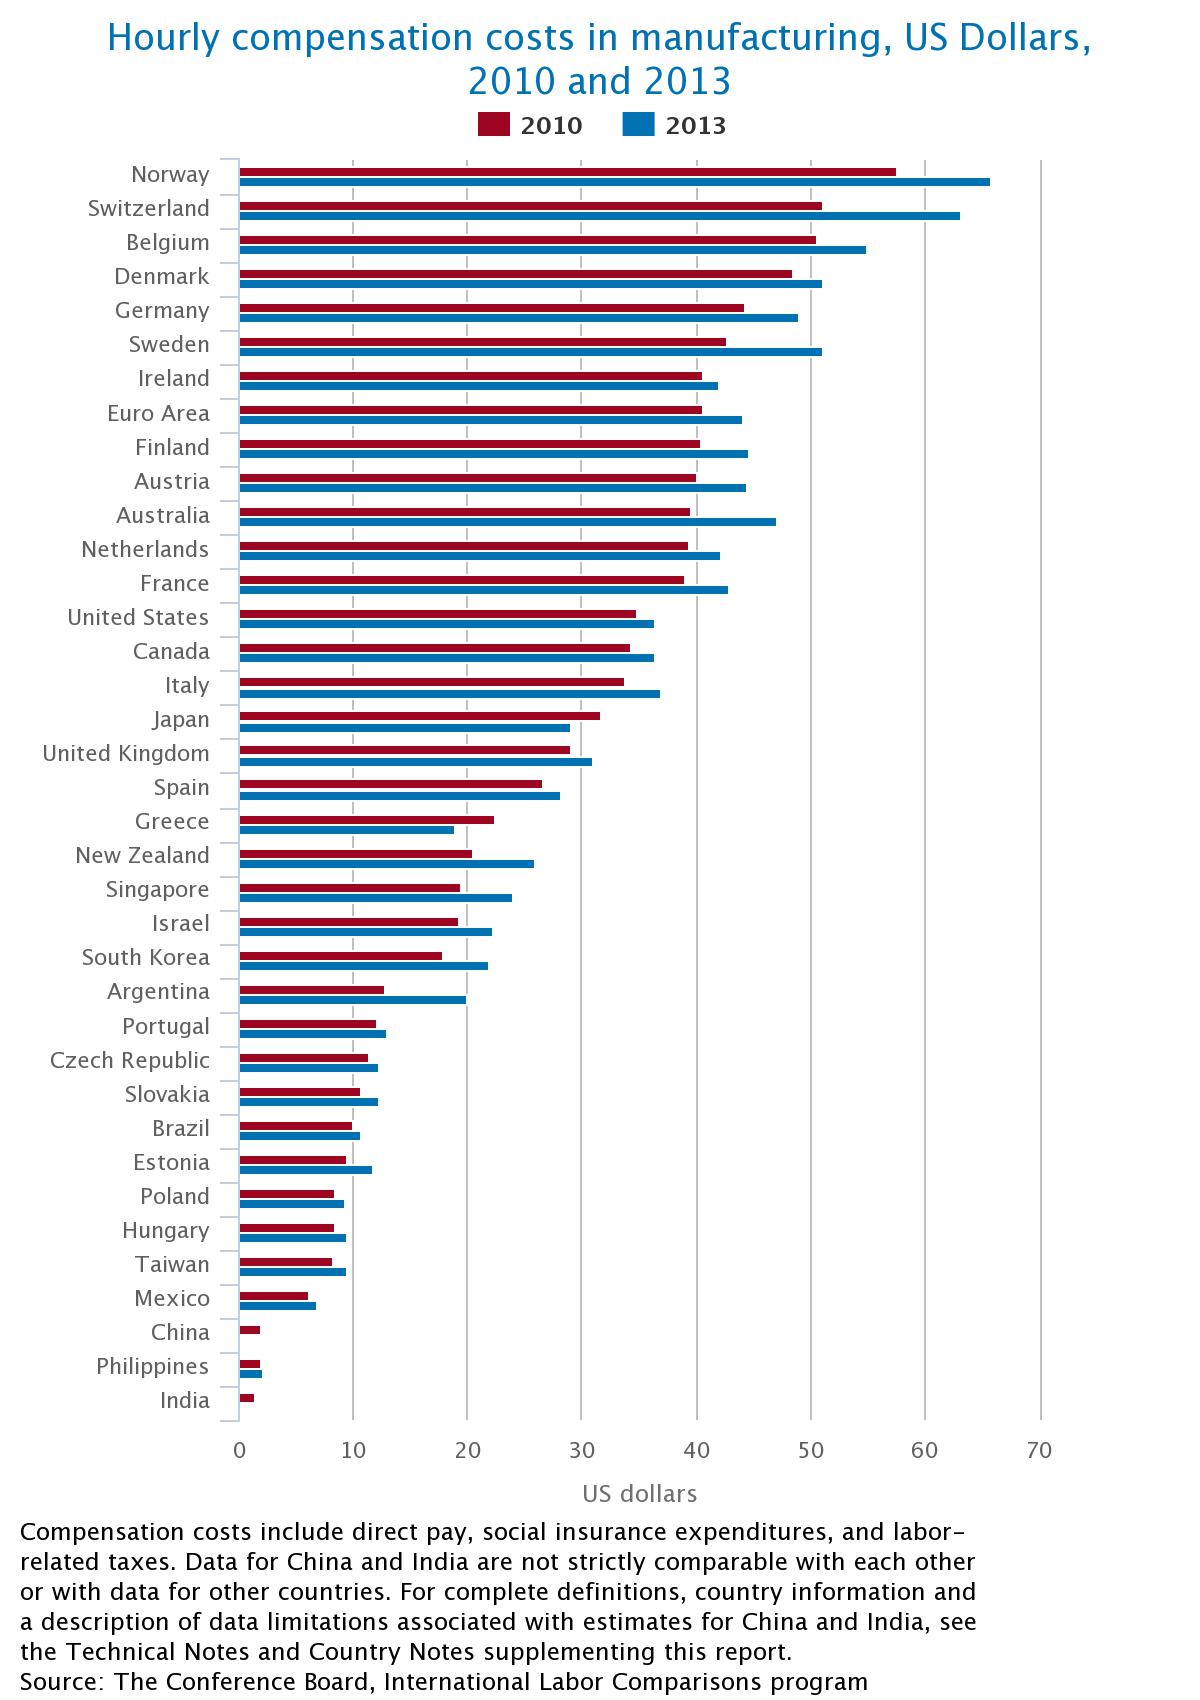
In comparison with 361 foreign economies, US manufacturing hourly compensation costs in 2013 ranked in the top third at $36.34 (see Chart 1). With the exception of Australia, countries with higher hourly compensation costs were primarily in northern and western Europe. In addition to Canada and the United Kingdom, countries with lower hourly compensation costs were primarily in southern and eastern Europe, Asia, and Latin America.
Between 1997 and 2013, compensation costs in manufacturing as a percent of US costs (see Table 1) increased in all economies compared except Japan, Taiwan and Brazil, improving US labor cost competitiveness.
Chart 1. Hourly compensation costs in manufacturing, US Dollars, 2010 and 2013
Click on the Chart to Browse Compensation Costs by Country.
In Chart 2, changes in a country’s compensation costs in US dollars (blue bars) are roughly equivalent to the change in compensation costs in a country’s national currency (red bars) plus the change in the value of the country’s currency relative to the US dollar (green bars). In 2013, nearly all countries had at least moderate increases in hourly compensation costs in national currency, but the currencies of most countries appreciated against the US dollar, resulting in US dollar-denominated hourly compensation costs increasing in most countries.
Relative to 2012, Japan, Greece, Brazil, Australia, Singapore, Canada and Taiwan all saw decreases in US dollar-denominated hourly compensation costs, reflecting improved labor-cost competitiveness against the US in 2013.
Chart 2. Annual percent change in hourly compensation costs in manufacturing and exchange rates, 2012-2013
Click on the Chart to Browse changes in Compensation Costs by Country.
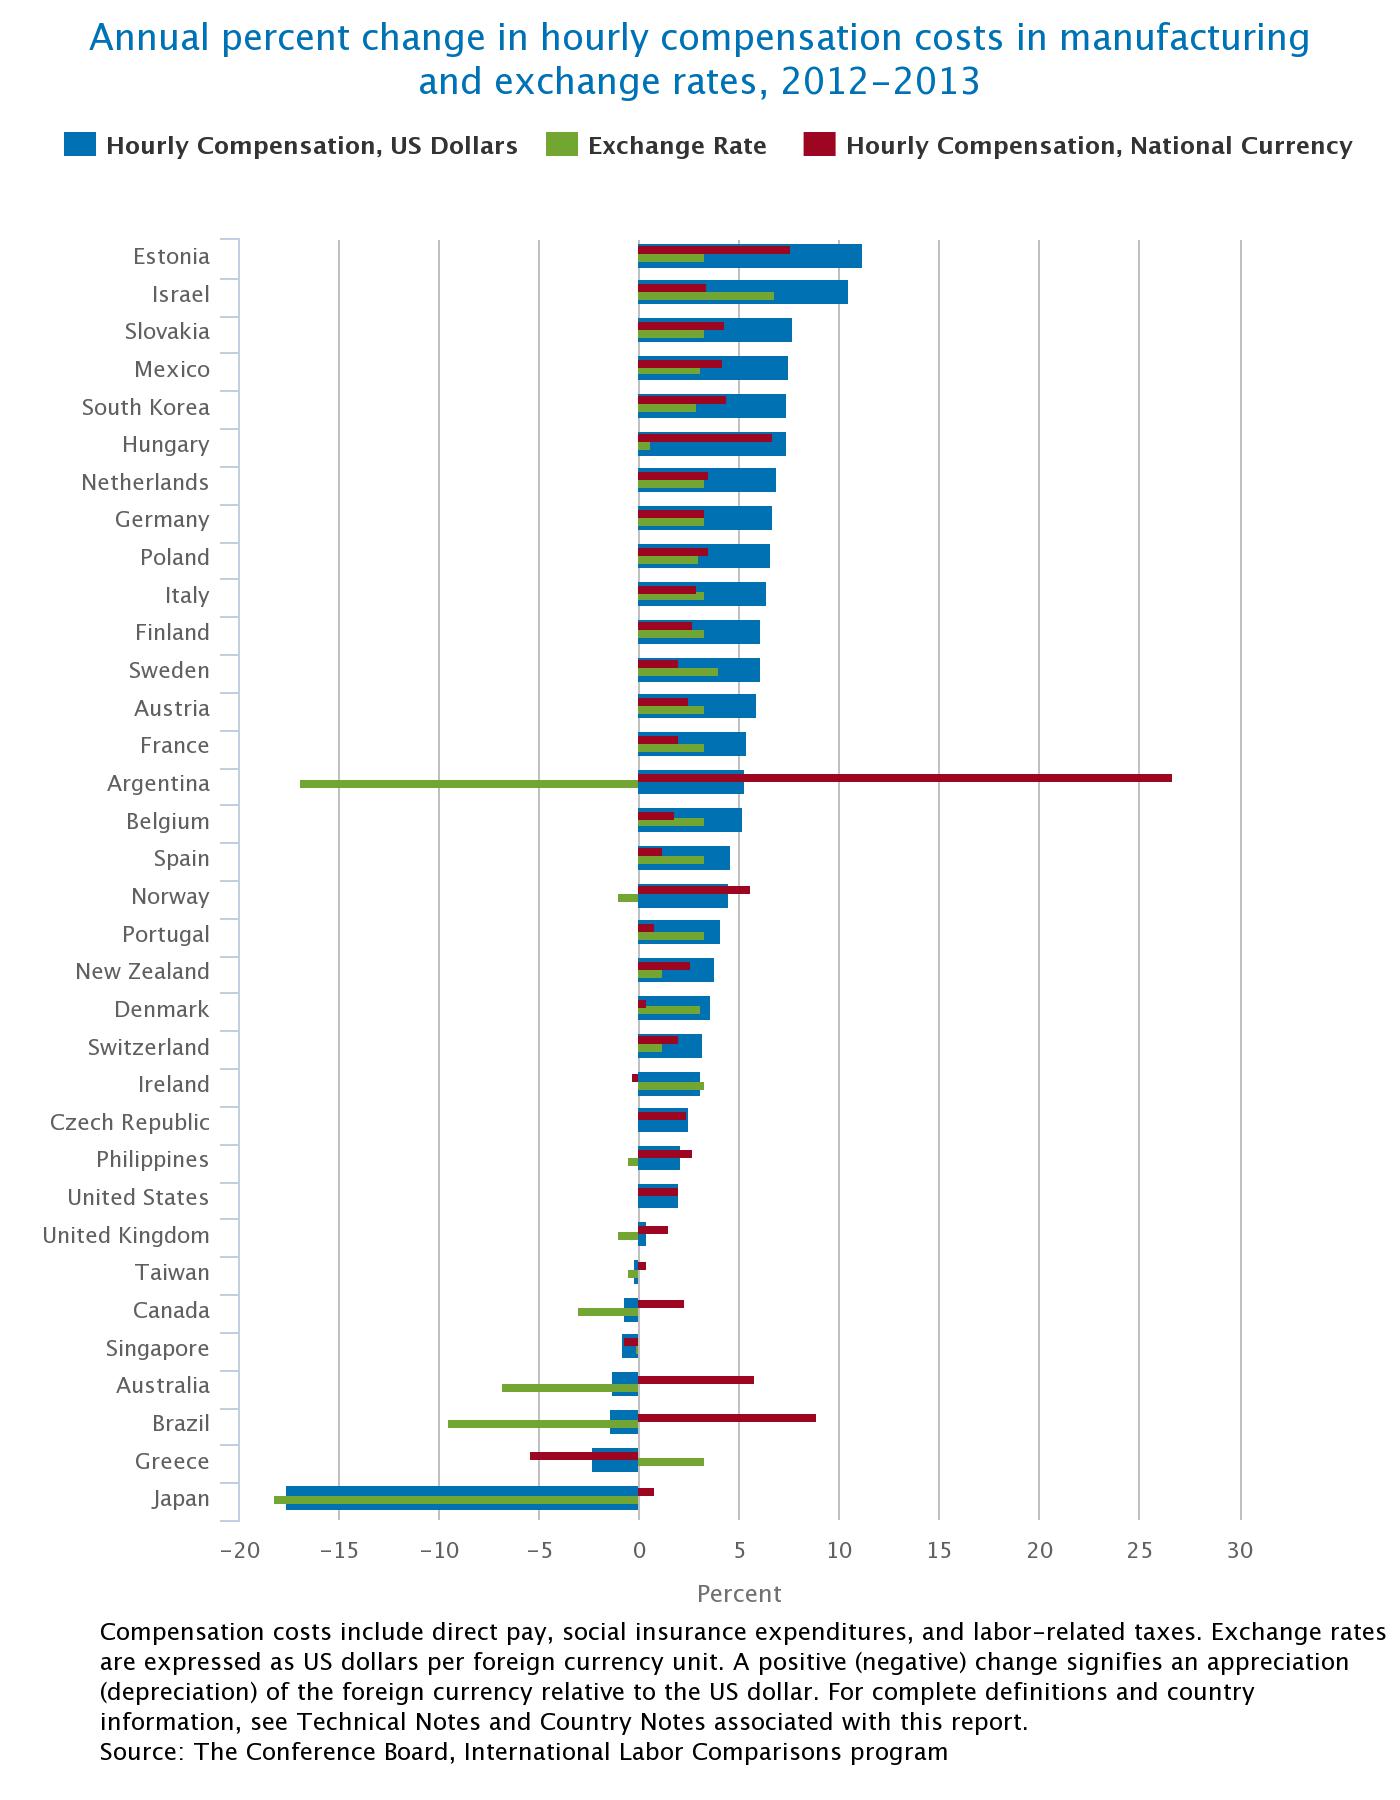
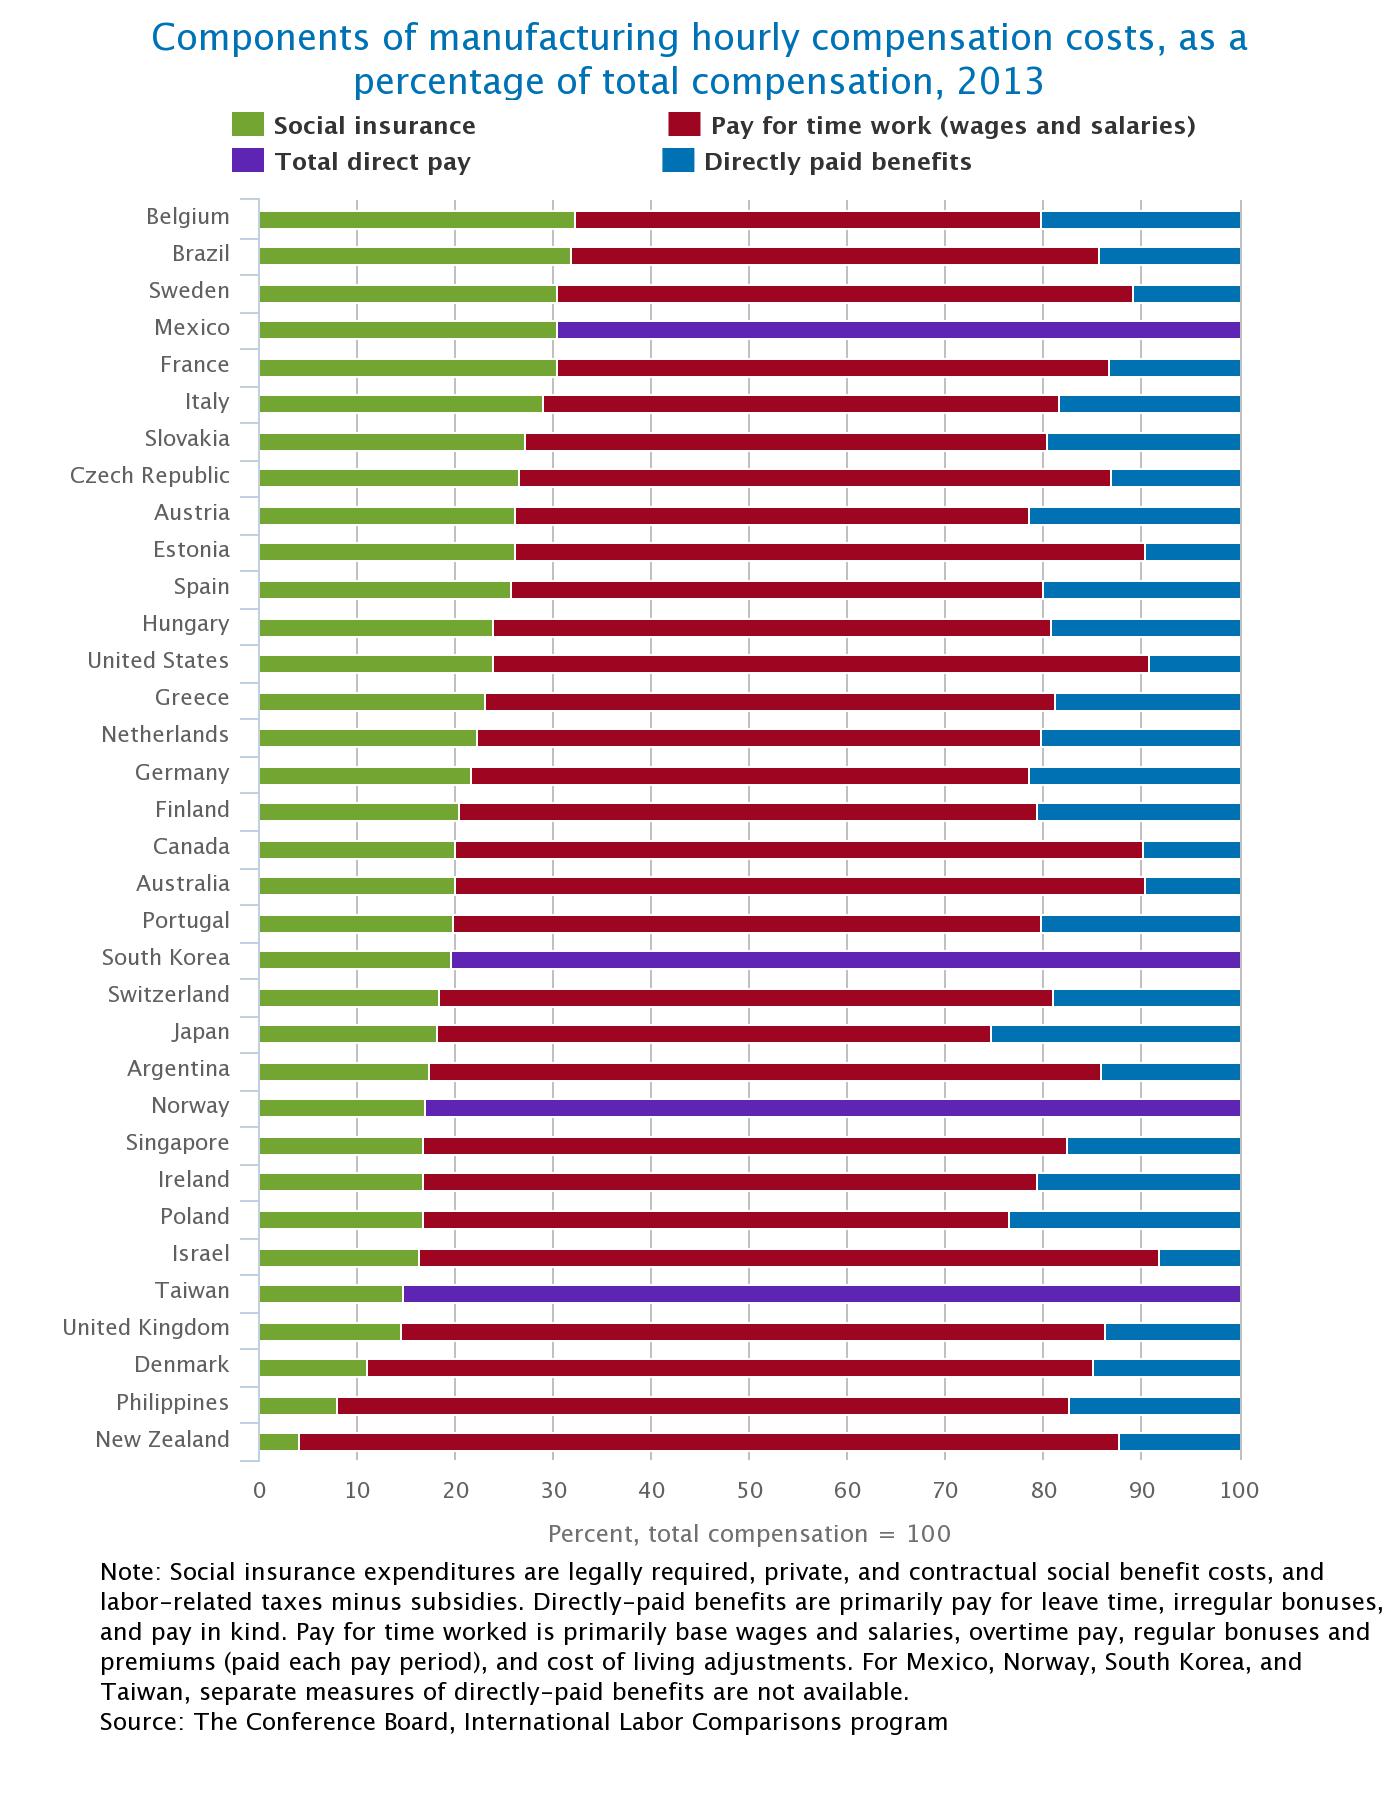
Chart 3 shows the benefit components of manufacturing employers’ compensation costs as a percent of total costs. (See Table 3 for data in US dollars.) Countries are ordered based on social insurance expenditures as a percent of total compensation. In countries with the highest ratio of social insurance costs, such as Belgium, Brazil and Sweden, social insurance makes up approximately one-third of total compensation costs. In the United States, social insurance costs account for about 24 percent of total compensation, while in the Asian countries, social insurance is less than 20 percent.
Directly-paid benefits primarily comprise pay for leave time, bonuses and pay in kind. The percentage of compensation that is directly-paid benefits tends to be higher in many European countries (due in large part to leave pay) and in Japan (where seasonal bonuses are a large portion of costs). Directly-paid benefits are a relatively smaller portion of costs in English-speaking countries including the United Kingdom, Canada, Australia and the United States.
The total benefits portion of compensation costs can be seen by combining social insurance with directly-paid benefits. Total benefits surpass 40 percent in 15 countries and are over 50 percent in Belgium. In contrast, the ratio of benefit costs in the United States is about 33 percent.
Chart 3. Components of manufacturing hourly compensation costs, as a percentage of total compensation, 2013
Click on the Chart to Browse Compensation Costs by Country.
The use of all TCB data and materials is subject to the Terms of Use. Reprint requests are reviewed individually and may be subject to additional fees. TCB reserves the right to deny any request.

