How the National Debt Affects All Generations of Americans
Our Privacy Policy has been updated! The Conference Board uses cookies to improve our website, enhance your experience, and deliver relevant messages and offers about our products. Detailed information on the use of cookies on this site is provided in our cookie policy. For more information on how The Conference Board collects and uses personal data, please visit our privacy policy. By continuing to use this Site or by clicking "ACCEPT", you acknowledge our privacy policy and consent to the use of cookies. 
Our Privacy Policy has been updated! Detailed information on the use of cookies on this site is provided in our cookie policy and our privacy policy. 
TCB Tourch
Loading...
  •  
    • NORTH AMERICA
    • EUROPE
    • ASIA
  • 2

    Close
    • Insights
        • Insights
        • Explore by Center
          • Explore by Center
          • The CEO Center

          • Economy, Strategy & Finance

          • Governance & Sustainability

          • Human Capital

          • Marketing & Communications

        • Explore by Content Type
          • Explore by Content Type
          • Reports

          • Upcoming Webcasts

          • On Demand Webcasts

          • Podcasts

          • Charts & Infographics

          • Explore All Research

          • Economic Indicators

        • Trending Topics
          • Trending Topics
          • Artificial Intelligence (AI)

          • Navigating Washington

          • Geopolitics

          • US Economic Forecast

          • Sustainability

          • Future of Work

          • Explore All Trending Topics

    • Events
        • Events
        • Upcoming Events
          • Upcoming Events
          • Reimagine Asia 2026: People & Business

          • CLO Governance Forum

          • Climate Under Pressure: A Corporate Fishbowl on Risk, Resilience, and Finance

          • Executive Compensation & Talent 2026

          • The Annual Employee Health Care Conference – Chicago

          • People First: Elevating Talent for the Future

          • Explore All Upcoming Events

          • TCB Speaker Bureau

          • Sponsor a Program

        • Member-Exclusive Programs
          • Member-Exclusive Programs
          • Center Briefings

          • Expert Briefings

          • Experts Live

          • Roundtables

          • Working Groups

          • View All Member-Exclusive Programs

          • View All Upcoming Events, Programs, and Webcasts

    • Data
        • Data
        • All Data

        • Data Central

        • Consumer Confidence Index®

        • TCB Benchmarking

        • Recession & Growth Trackers

        • Global Economic Outlook

        • Leading Economic Indicators

        • Help Wanted OnLine

        • Labor Markets

        • Measure of CEO Confidence

        • Global Gray Swans Tool

        • CMO+CCO Meter Dashboard

    • Centers
        • Centers
        • Our Centers
          • Our Centers
          • The CEO Center

          • Economy, Strategy & Finance

          • Governance & Sustainability

          • Human Capital

          • Marketing & Communications

    • Councils
        • Councils
        • Find a Council
          • Find a Council
          • Economy, Strategy & Finance

          • Governance & Sustainability

          • Human Capital

          • Marketing & Communications

          • Canada Councils

          • Explore All Councils

        • Council Membership
          • Council Membership
          • What is a Council?

          • Benefits of Council Membership

          • Apply to a Council

    • Membership
        • Membership
        • Types of Membership
          • Types of Membership
          • Membership at a Glance

          • Executive

          • C-Suite

          • Leadership Team

          • Council

          • Higher Education

          • Insights

        • Already a Member?
          • Already a Member?
          • Check if Your Organization is a Member

          • Sign In to myTCB®

          • Executive Communities

          • Member-Exclusive Programs

          • Refer a Leader - Earn a Reward

    • About Us
        • About Us
        • Who We Are
          • Who We Are
          • About Us

          • In the News

          • Press Releases

          • Our History

          • Support Our Work

          • Locations

          • The Conference Board of Canada

          • Contact Us

        • Our Community
          • Our Community
          • Our Leadership

          • Our Experts

          • TCB Speaker Bureau

          • Trustees

          • Voting Members

          • Global Counsellors

          • Careers

          • This Week @ TCB

          • Continuing Education Credits (CEUs)

    • Careers
    • This Week @ TCB
    • Sign In to myTCB®
      • NORTH AMERICA
      • EUROPE
      • ASIA
    • Insights
      • Insights
      • Explore by Center
        • Explore by Center
        • The CEO Center

        • Economy, Strategy & Finance

        • Governance & Sustainability

        • Human Capital

        • Marketing & Communications

      • Explore by Content Type
        • Explore by Content Type
        • Reports

        • Upcoming Webcasts

        • On Demand Webcasts

        • Podcasts

        • Charts & Infographics

        • Explore All Research

        • Economic Indicators

      • Trending Topics
        • Trending Topics
        • Artificial Intelligence (AI)

        • Navigating Washington

        • Geopolitics

        • US Economic Forecast

        • Sustainability

        • Future of Work

        • Explore All Trending Topics

    • Events
      • Events
      • Upcoming Events
        • Upcoming Events
        • Reimagine Asia 2026: People & Business

        • CLO Governance Forum

        • Climate Under Pressure: A Corporate Fishbowl on Risk, Resilience, and Finance

        • Executive Compensation & Talent 2026

        • The Annual Employee Health Care Conference – Chicago

        • People First: Elevating Talent for the Future

        • Explore All Upcoming Events

        • TCB Speaker Bureau

        • Sponsor a Program

      • Member-Exclusive Programs
        • Member-Exclusive Programs
        • Center Briefings

        • Expert Briefings

        • Experts Live

        • Roundtables

        • Working Groups

        • View All Member-Exclusive Programs

        • View All Upcoming Events, Programs, and Webcasts

    • Data
      • Data
      • All Data

      • Data Central

      • Consumer Confidence Index®

      • TCB Benchmarking

      • Recession & Growth Trackers

      • Global Economic Outlook

      • Leading Economic Indicators

      • Help Wanted OnLine

      • Labor Markets

      • Measure of CEO Confidence

      • Global Gray Swans Tool

      • CMO+CCO Meter Dashboard

    • Centers
      • Centers
      • Our Centers
        • Our Centers
        • The CEO Center

        • Economy, Strategy & Finance

        • Governance & Sustainability

        • Human Capital

        • Marketing & Communications

    • Councils
      • Councils
      • Find a Council
        • Find a Council
        • Economy, Strategy & Finance

        • Governance & Sustainability

        • Human Capital

        • Marketing & Communications

        • Canada Councils

        • Explore All Councils

      • Council Membership
        • Council Membership
        • Benefits of Council Membership

        • Apply to a Council

        • Our Program Directors

        • Refer a Leader - Earn a Reward

    • Membership
      • Membership
      • Types of Membership
        • Types of Membership
        • Membership at a Glance

        • Executive

        • C-Suite

        • Leadership Team

        • Council

        • Higher Education

        • Insights

      • Already a Member?
        • Already a Member?
        • Check if Your Organization is a Member

        • Sign In to myTCB®

        • Executive Communities

        • Member-Exclusive Programs

        • Refer a Leader - Earn a Reward

    • About Us
      • About Us
      • Who We Are
        • Who We Are
        • About Us

        • In the News

        • Press Releases

        • This Week @ TCB

        • Our History

        • Support Our Work

        • Locations

        • The Conference Board of Canada

        • Contact Us

      • Our Community
        • Our Community
        • Our Leadership

        • Our Experts

        • TCB Speaker Bureau

        • Trustees

        • Voting Members

        • Global Counsellors

        • Careers

        • This Week @ TCB

        • Continuing Education Credits (CEUs)

    • Careers
    • Sign In to myTCB®
    • Download TCB Insights App
  • Insights
    Insights

    Our research and analysis have helped the world's leading companies navigate challenges and seize opportunities for over 100 years.

    Economic Indicators

    • Explore by Center
    • The CEO Center
    • Economy, Strategy & Finance
    • Governance & Sustainability
    • Human Capital
    • Marketing & Communications
    • Explore by Content Type
    • Reports
    • Upcoming Webcasts
    • On Demand Webcasts
    • Podcasts
    • Charts & Infographics
    • Trending Topics
    • Artificial Intelligence (AI)
    • Navigating Washington
    • Geopolitics
    • US Economic Forecast
    • Sustainability
    • Future of Work
    • Explore All Trending Topics
  • Events
    Events

    Our in-person and virtual events offer unmatched opportunities for professional development, featuring top experts and practitioners.

    View All Upcoming Events, Programs, and Webcasts

    TCB Speaker Bureau

    Sponsor a Program

    • Upcoming Events
    • Reimagine Asia 2026: People & Business

      September 10, 2026

      CLO Governance Forum

      September 10, 2026

      Climate Under Pressure: A Corporate Fishbowl on Risk, Resilience, and Finance

      September 22, 2026

    •  
    • Executive Compensation & Talent 2026

      September 24 - 25, 2026

      The Annual Employee Health Care Conference – Chicago

      September 24 - 25, 2026

      People First: Elevating Talent for the Future

      October 06 - 07, 2026

    • Member-Exclusive Programs
    • Center Briefings
    • Expert Briefings
    • Experts Live
    • Roundtables
    • Working Groups
    • View All Member-Exclusive Programs
    • Explore by Type
    • Events
    • Webcasts
    • Podcasts
    • Member-Exclusive Programs
    • Center Briefings
    • Expert Briefings
    • Experts Live
    • Roundtables
    • Working Groups
    • View All Member-Exclusive Programs
  • Data
    Corporate Disclosure Data

    TCB Benchmarking

    Real-time data visualizations to benchmark your governance, compensation, environmental, human capital management (HCM) and social practices against US public companies.

    Economic Data

    All Data

    Data Central

    One-stop portal for the entire suite of indicators

    Consumer Confidence Index®

    Labor Markets

    Measure of CEO Confidence

    Global Gray Swans Tool

    Prepare for high-impact events


    Recession & Growth Trackers

    Current & future state of 16 economies

    Global Economic Outlook

    Growth outlooks for 77 economies

    Leading Economic Indicators

    State of the business cycle for 12 global economies across Asia and Europe

    Help Wanted OnLine

    Status of the US job market

    Other Featured Data

    CMO+CCO Meter Dashboard

  • Centers
    Centers

    Centers offer access to world-class experts, research, events, and senior executive communities.

    Our Centers
    • The CEO Center
    • Economy, Strategy & Finance
    • Governance & Sustainability
    • Human Capital
    • Marketing & Communications
  • Councils
    Councils

    Councils are invitation-only, peer-led communities of senior executives that come together to exchange knowledge, accelerate career development, and advance their function.

    Find a Council
    • Economy, Strategy & Finance
    • Governance & Sustainability
    • Human Capital
    • Marketing & Communications
    • Canada Councils
    • Explore All Councils
    Council Membership
    • Benefits of Council Membership
    • Apply to a Council
    • Our Program Directors
    • Refer a Leader - Earn a Reward
  • Membership
    Membership

    Membership in The Conference Board arms top executives and their teams with an arsenal of knowledge, networks, and expertise that's unmatched in scope and depth.

    • Types of Membership
    • Membership at a Glance
    • Executive
    • C-Suite
    • Leadership Team
    • Council
    • Higher Education
    • Insights
    • Already a Member?
    • Check if Your Organization is a Member
    • Sign in to myTCB®
    • Executive Communities
    • Member-Exclusive Programs
    • Refer a Leader - Earn a Reward
  • About Us
    About Us

    The Conference Board is the global, nonprofit think tank and business membership organization that delivers Trusted Insights for What's Ahead®. For over 100 years, our cutting-edge research, data, events and executive networks have helped the world's leading companies understand the present and shape the future.

    • Who We Are
    • About Us
    • In the News
    • Press Releases
    • Our History
    • Support Our Work
    • Locations
    • The Conference Board of Canada
    • Contact Us
    • Our Community
    • Our Leadership
    • Our Experts
    • TCB Speaker Bureau
    • Trustees
    • Voting Members
    • Careers
    • This Week @ TCB
    • Continuing Education Credits (CEUs)
Check if You're a Member
Create Account
Forgot Your Password?

Members of The Conference Board get exclusive access to the full range of products and services that deliver Trusted Insights for What's Ahead ® including webcasts, publications, data and analysis, plus discounts to conferences and events.

Solutions Briefs

How the National Debt Affects All Generations of Americans

18 August 2026 / Report

Download Report
  • Email
  • Linkedin
  • Facebook
  • X
  • Copy Link

The national debt is often discussed in terms of trillions of dollars, budget projections, and other macroeconomic measures that feel distant from everyday life. Yet the consequences are not abstract. Rising debt affects the cost of borrowing, economic opportunity, and financial security for Americans of all ages. Without a clearer understanding of these impacts, public concern remains muted and policymakers face less pressure to act.

This report makes the issue tangible. It models five fiscal paths—a baseline scenario, a deficit-reduction scenario, a higher-deficit scenario, and two global financial shocks—and examines their effects on the national debt and interest rates. It then brings those outcomes to life through case studies of a student, a family of four, a future retiree, and a small business owner.

Trusted Insights for What’s Ahead®

  • High levels of debt require the Federal government to spend more on interest payments, leaving fewer resources available for other priorities. If investors begin to view US debt as riskier, interest rates could rise further, increasing private sector borrowing costs for expansion, hiring, and investment.
  • Compared to the baseline scenario, reducing the deficit leads to a relatively flat national debt as a percentage of GDP and produces lower interest rates. Increasing the deficit compared to the baseline significantly increases the debt-to-GDP ratio and causes increases in the interest rate for government bonds. A global financial shock in the form of a week-long default of the US government debt in 2029 causes a significant spike in interest rates, near-term economic volatility, and a higher level of interest rates in the long term. An economic shock where interest rates double from the baseline filters throughout the economy, significantly raising mortgage rates and other costs.
  • The differences in interest rates lead to meaningful outcomes over the next decade for Americans, particularly Americans living under tight budgets. Under the scenario in which deficits are lower compared to the baseline, student loan costs decreased by 2.7%, housing costs between 1.8% and 3.7%, and small business loan payments by 7%. Conversely, increasing deficits over the baseline leads to student loan costs increasing by 3.2%, housing costs between 1.9% and 3.6%, and small business loan payments by 7%. The one-week government default leads to student loan costs increasing by 8.7%, housing costs between 4.6% and 6.7%, and small business loan payments by 21.6%. The extreme interest rate shock increases student loan costs by 61%, housing costs between 26% and 29%, and small business loan costs by 67%.
  • The primary Trust Fund for Social Security retirement benefits will become insolvent in 2032, according to the Congressional Budget Office (CBO). Assuming monthly benefits equal to payable amounts from the Trust Fund, a future retiree collecting a monthly retirement benefit of $2,100 faces a monthly benefit cut of $170 in 2032 and more than $700 in subsequent years, per CBO estimates.
  • These numbers can have profound impacts on the decisions of many individual Americans whether to attend college and when to form a family, purchase a home, or build a business.

Policy Recommendations

To address our unsustainable national debt, policymakers should consider the following recommendations:

  • Establish a bipartisan fiscal commission in Congress to improve the long-term fiscal condition of the Federal government, hold the expected debt-to-GDP ratio to a more sustainable level (such as 100%), and address the long-term solvency of the Social Security and Medicare Trust Funds.
  • Save Social Security to avoid short-term insolvency and establish long-term fiscal sustainability through a combination of benefit adjustments, revenue raisers, and considering diversification of Trust Fund investments.
  • Modernize Medicare and other major Federal health care programs through innovative strategies, including value-based care and alternative payment models; reforms to Medicare Advantage; adjustments to premiums, cost sharing, and prescription drug payments; an emphasis on primary care and care coordination; and streamlined regulations.
  • Reform the broken Congressional budget process by implementing comprehensive solutions that improve timeliness throughout the process, mitigate challenges to regular order, permit greater debate on important topics, and incorporate longer-term planning into budget development.

Why Is the National Debt a Problem?

America does not look like a nation in fiscal distress—and that’s exactly the problem.1 The S&P 500 has more than doubled in the past five years. Unemployment (U-3) is at a multidecade low. Social Security checks are going out. But these surface-level indicators hide deeper vulnerabilities. The national debt is on track to reach levels never seen outside of wartime—projected to climb to roughly 120% of GDP within the next decade. That means that the Federal government would owe 20% more than the entire annual output of the US economy.

That trajectory will not trigger an alarm bell overnight. As Ernest Hemingway wrote, bankruptcy happens “gradually and then suddenly.” The same can be true of fiscal decline. The US has over $39 trillion of national debt. We now spend more annually on interest on that debt than on defense. The primary Trust Funds for Social Security and Medicare are also projected to become insolvent within the next seven years, requiring automatic benefit cuts, payroll tax increases, sharp premium increases in the case of Medicare, or even more deficit spending to backfill these programs. These pressures will intensify as the population ages, health care costs rise, and economic growth slows.

That point is clear: economic growth alone will not address structural challenges in the budget. The Conference Board® forecasts that US growth is expected to slow for the remainder of the 2020s and the 2030s—the very period when the debt is projected to rise significantly—because of demographic headwinds and higher structural interest rates.2 Moreover, leaving aside the 2001 market downturn, the 2008 financial crisis, and the COVID-19 pandemic, the national debt has accumulated during a period of relative economic prosperity and strong gains in equity markets. This raises further alarm. Economic growth, of itself, is important but cannot be the sole solution.

In extreme cases, a country’s debt burden can become too heavy, leading to a sovereign debt default. Recent examples of these debt crises include the Tequila crisis in Mexico in 1994, the Russian financial crisis in 1998, the Asian financial crisis of 1997–98, and the Argentinian economic crisis of 2001–02.3 A debt crisis is often accompanied by a banking and/or currency crisis, affecting the country’s financial system, value of its national currency, and international trade. As interest rates soar amid the default, economic growth stagnates and faith in government and other institutions falters.

For American businesses, the looming debt crisis carries tangible, real-world consequences. High levels of debt require the Federal government to spend more on interest payments, leaving fewer resources available for infrastructure, education, national defense, and social programs. If investors begin to view US debt as riskier, interest rates could rise further, increasing borrowing costs for expansion, hiring, and investment.

All Americans will feel the effects of the debt crisis. Current retirees and those approaching retirement age (especially those with limited pensions and retirement savings) will be at risk of losing crucial income, health, and long-term care support. Younger generations will also have to bear the burden of reducing the national debt with less fiscal flexibility to address long-term, structural challenges. In short, the high national debt prevents us from investing fully in America’s future.

Nevertheless, it is not intuitive to translate broader macroeconomic effects into the debt’s tangible impacts on Americans. Discussions of astronomical figures in the trillions utilizing economic jargon are too abstract and removed from the lives of most Americans. For example, dividing the $39.7 trillion in total public debt outstanding by the US population of 342.7 million (as of July 2026) results in a debt burden of approximately $116,000 per American. But what does that actually mean for individuals?

The debt will also affect different generations of Americans in distinct ways, preventing a simple narrative or conclusion from emerging. This disconnect impedes the national debt from becoming a priority issue for voters, with voters understandably focusing on immediate and urgent issues that clearly affect them. Without a signal from voters that the debt is a priority, lawmakers will in turn not prioritize the difficult tradeoffs necessary to set our fiscal trajectory on a better path.

Debt Scenarios

To illustrate the microeconomic impacts of our unsustainable national debt, it is important to consider several scenarios regarding the annual budget deficit, which adds to the national debt. By studying the effects of reducing the deficit or letting it get further out of control, Americans can visualize the consequences of the national debt on their lives and financial decisions.

Overview

The modeling in this report utilizes The Conference Board’s model for forecasting economic growth and other macroeconomic variables. The modeling varies the annual deficit over a 10-year period across three scenarios: a baseline (debt is 6–7% of GDP), a “good” case (debt falls over time to 3% of GDP), and a “bad” case (debt rises to 9%). Based on the different annual deficits, the modeling then produces outputs of macroeconomic variables, such as the total national debt, GDP, and interest rates. From this, the model then estimates the impact on important life decisions such as taking out a student loan, purchasing a home, or building a small business (which could require taking out a small business loan).

For the baseline scenario, the modeling uses the latest budgetary projections from the CBO. CBO is an independent entity in Congress that provides objective, nonpartisan information to support the Congressional budget process and to help the legislative branch make effective budget and economic policy.4 In the CBO’s most recent 10-year budgetary projections, the Federal government runs an annual deficit of between 6–7% of GDP (which means the absolute deficit rises as the economy grows).5 

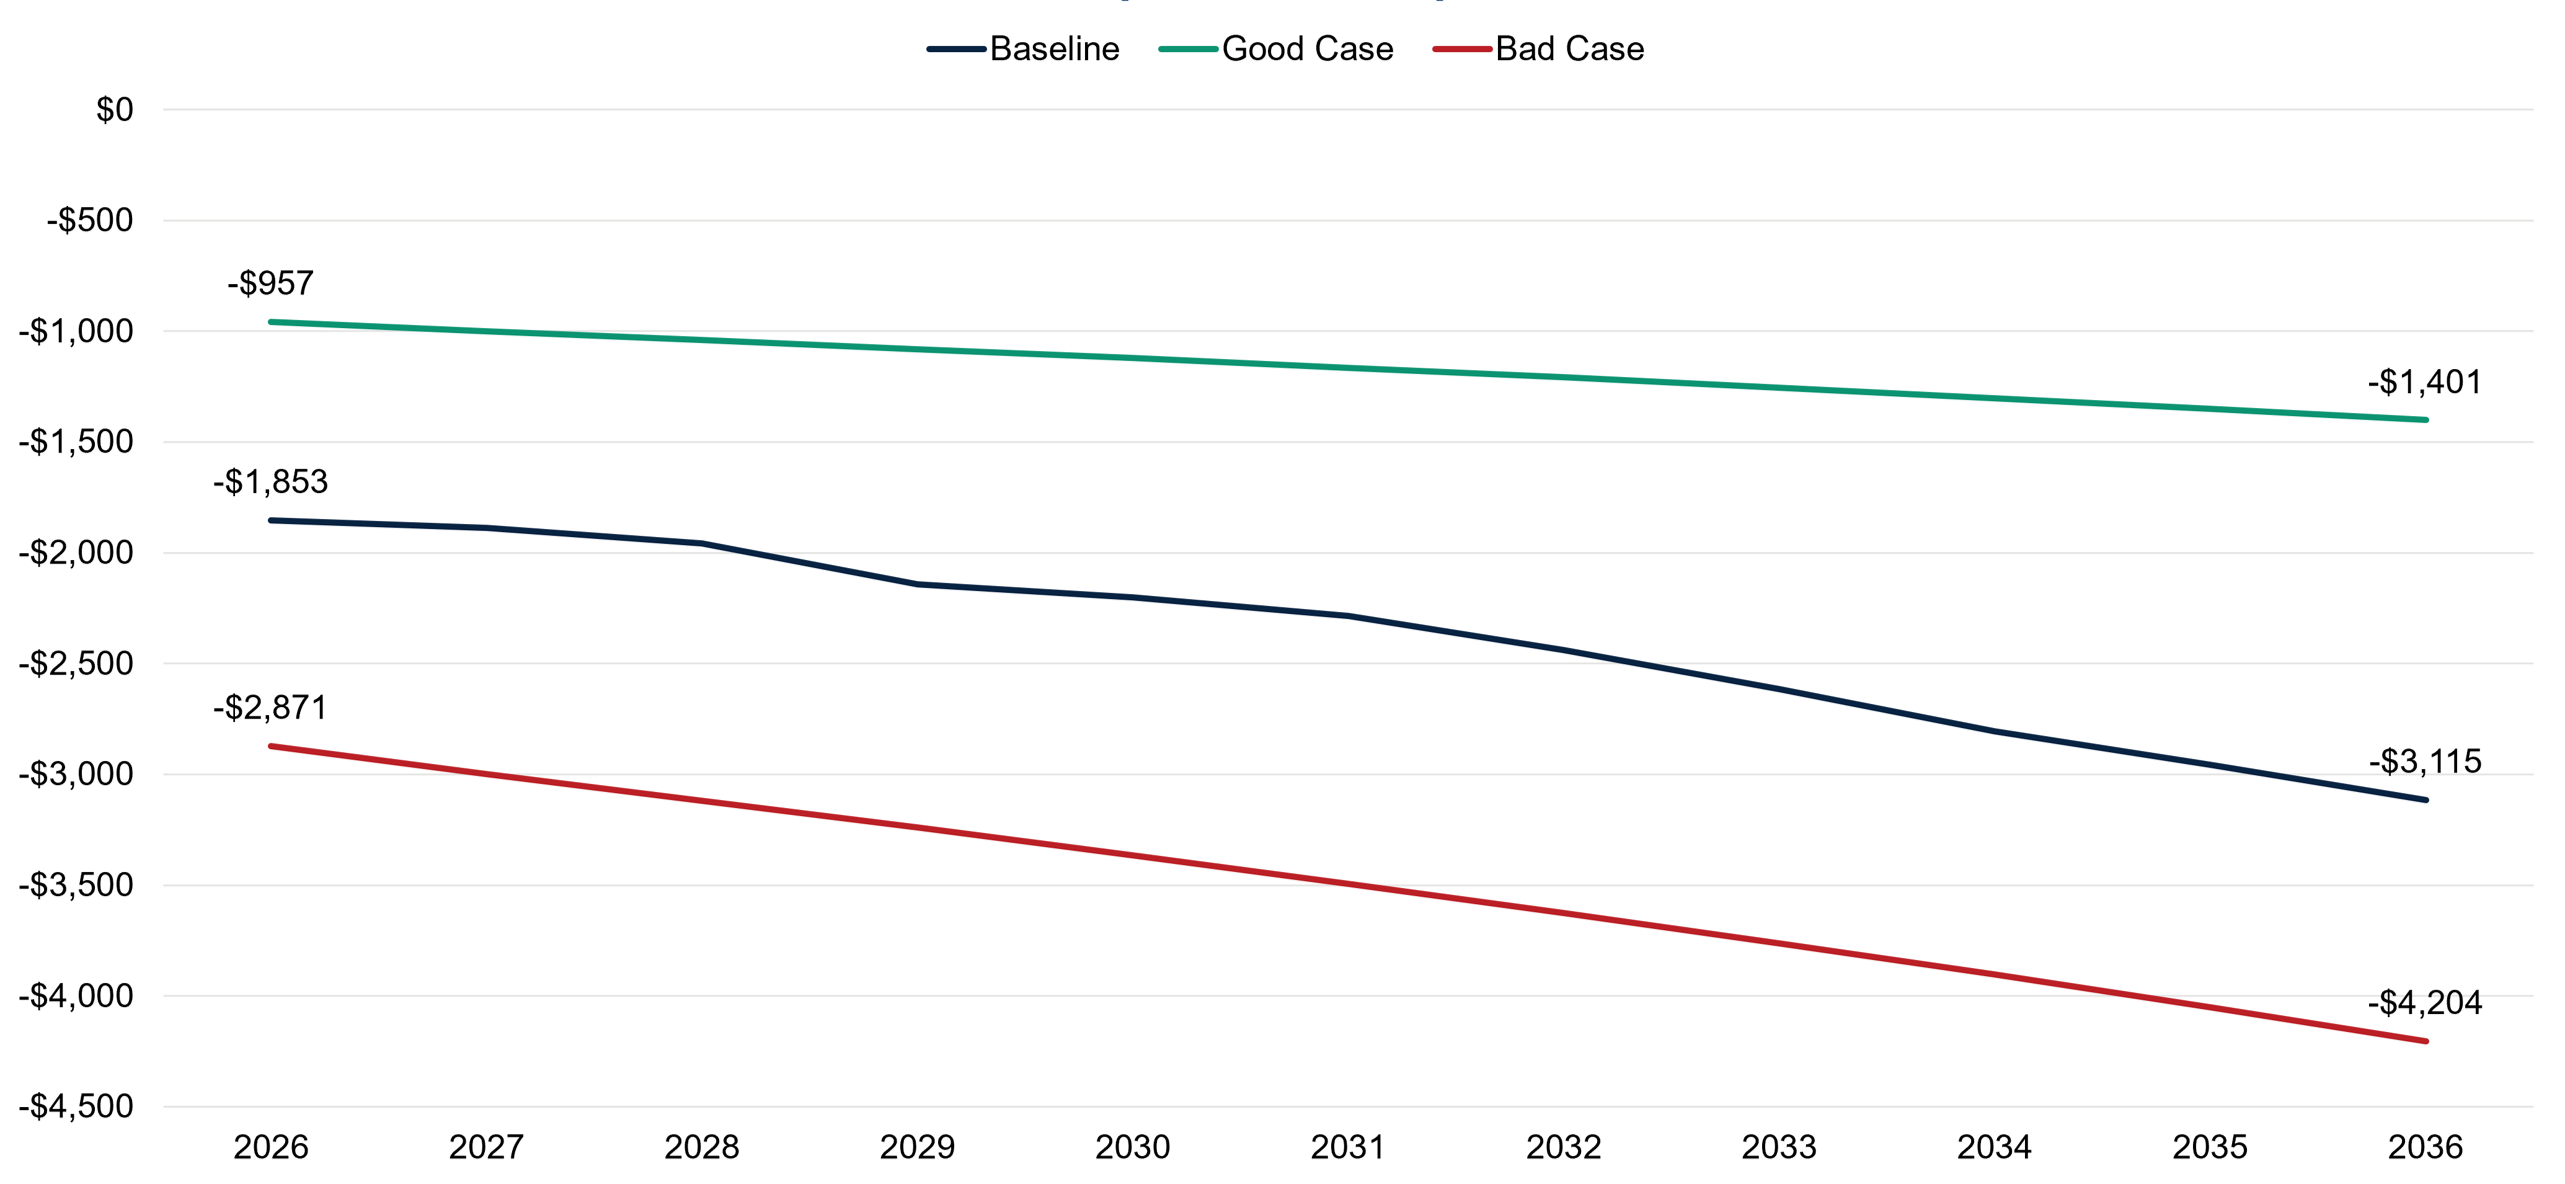
Figure 1

Annual deficit for each scenario ($ billion)

Source: The Conference Board, 2026

The good-case scenario assumes the Federal government reduces the annual deficit to 3% of GDP, cutting the baseline deficit by roughly half (the modeling is designed to produce a consistent scenario). This level of annual deficits still increases the total national debt, but it would help stabilize debt in relation to the size of the economy and represents a significantly improved fiscal outlook. The bad-case scenario assumes the baseline deficit grows by a similar magnitude, increasing the annual deficit to 9% of GDP. This scenario represents a significant worsening of the fiscal outlook and will demonstrate that it is also worthwhile for policymakers to prevent further deterioration of the deficit.

Finally, the modeling analyzes two additional scenarios to simulate global financial shocks: a week-long default of the US Federal government debt in 2029 (the year the current debt ceiling is projected to be reached) and an extreme interest rate shock where the interest rates in the baseline scenario double. The US has approached a default on its debt during debates in Congress on raising or suspending the debt ceiling in 2023 and 2025, as the US Treasury was forced to undertake extraordinary measures to prevent a default on the national debt. The extreme interest rate shock seeks to model the economic conditions of the 1980s, when the interest rate for 10-year US government bonds was regularly 8–15%.6 The modeling projects interest rates and mortgage rates under these global shock scenarios to demonstrate the enduring consequences of the associated economic turbulence (for purposes of modeling, the shock begins in 2026 and extends throughout the forecast period).

Analysis

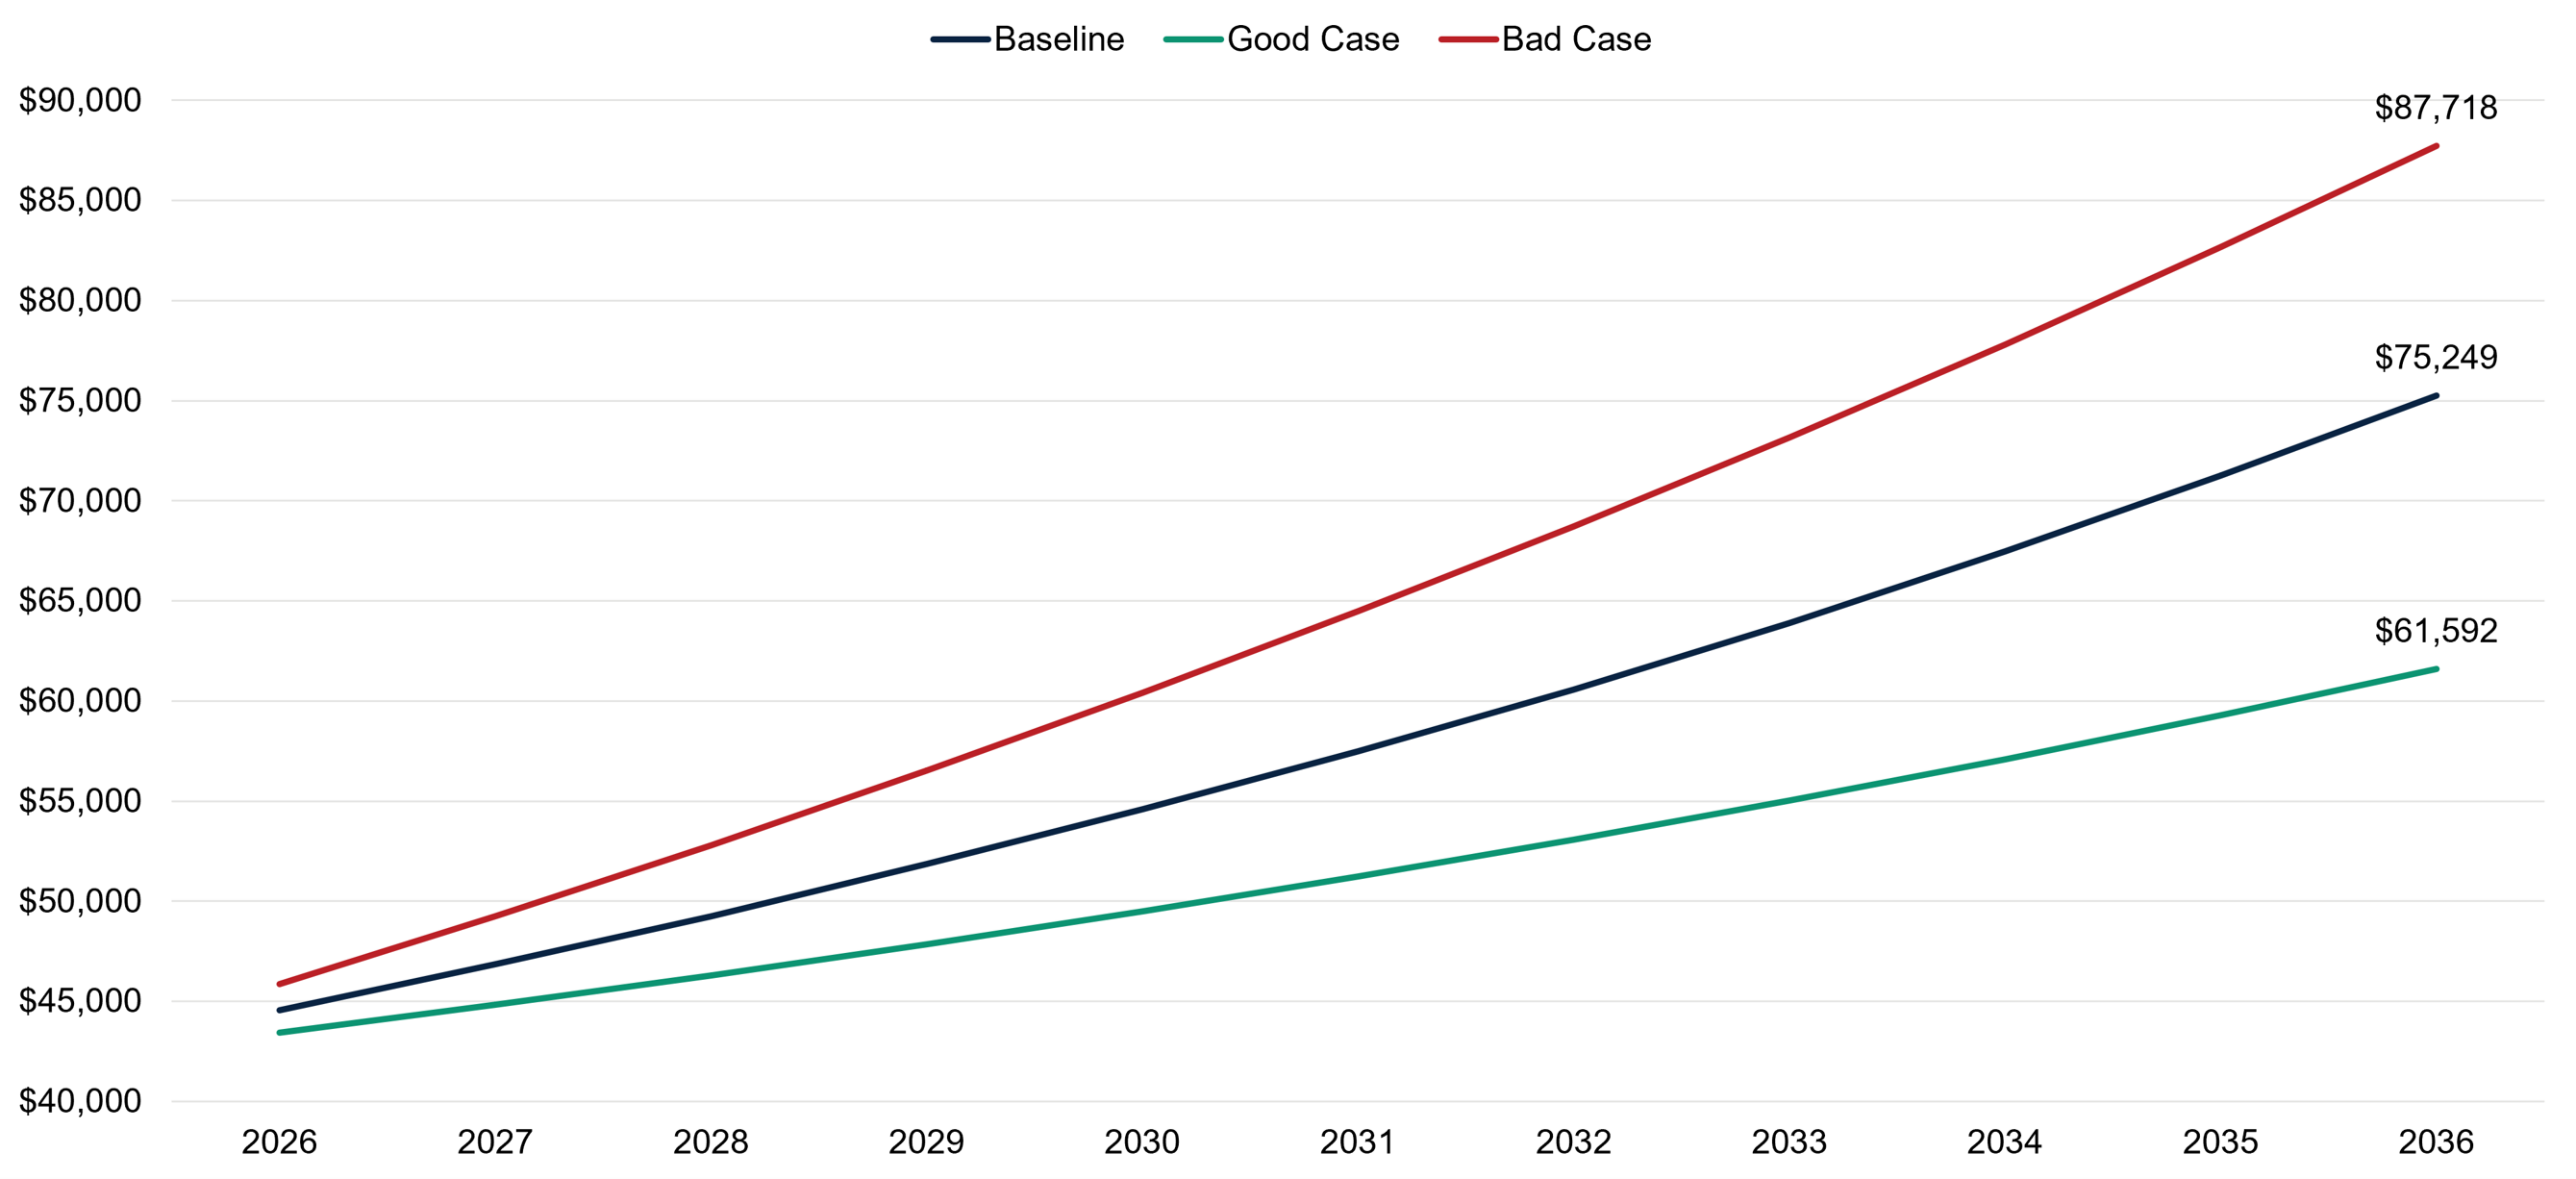
Every year the Federal government runs a deficit, the national debt grows as the government must sell bonds to finance the gap between spending and revenues. The modeling demonstrates this crucial point, with the national debt naturally growing in all three scenarios. Larger deficits produce more national debt. The debt in 2036 under the bad-case scenario is more than 16% higher than in the baseline scenario. Action on reducing the deficit also produces positive results for the national debt, with the debt in the good-case scenario 18% lower than in the baseline scenario (but still growing).

It is important to note that budgetary projections from the CBO and the White House Office of Management and Budget (OMB) routinely understate the future level of debt. (The CBO is bound to accept a “current law” baseline as the foundation of its analysis). For example, in early 2018 the CBO projected the debt held by public at the end of 2025 to be $24.3 trillion, or 91.5% of GDP.7 In its 2018 President’s Budget release, OMB projected the debt held by the public in 2025 to be $22.1 trillion, or 78.4% of GDP.8 The actual debt held by the public in 2025 was $30.2 trillion or 99.4% of GDP, roughly $6 trillion–8 trillion (or 24–37%) higher than the CBO and OMB estimates in 2018.9 It is difficult to account for future interest rate levels, inflation, economic growth, and geopolitical events in budget projections. Nevertheless, this trend suggests that the modeling using the CBO’s baseline projections is likely a conservative estimate and the true level of future debt may be higher.

Figure 2

Total national debt (nominal, $ billion)


Source: The Conference Board, 2026

In analyzing the national debt, it is important to put the debt into context. A standard method to contextualize the debt is comparing it to GDP, the total annual economic output of the economy. This comparison gives a sense of a country’s ability to pay back its debt, along the lines of how a bank evaluates a person’s income and assets to assess whether to provide a loan.

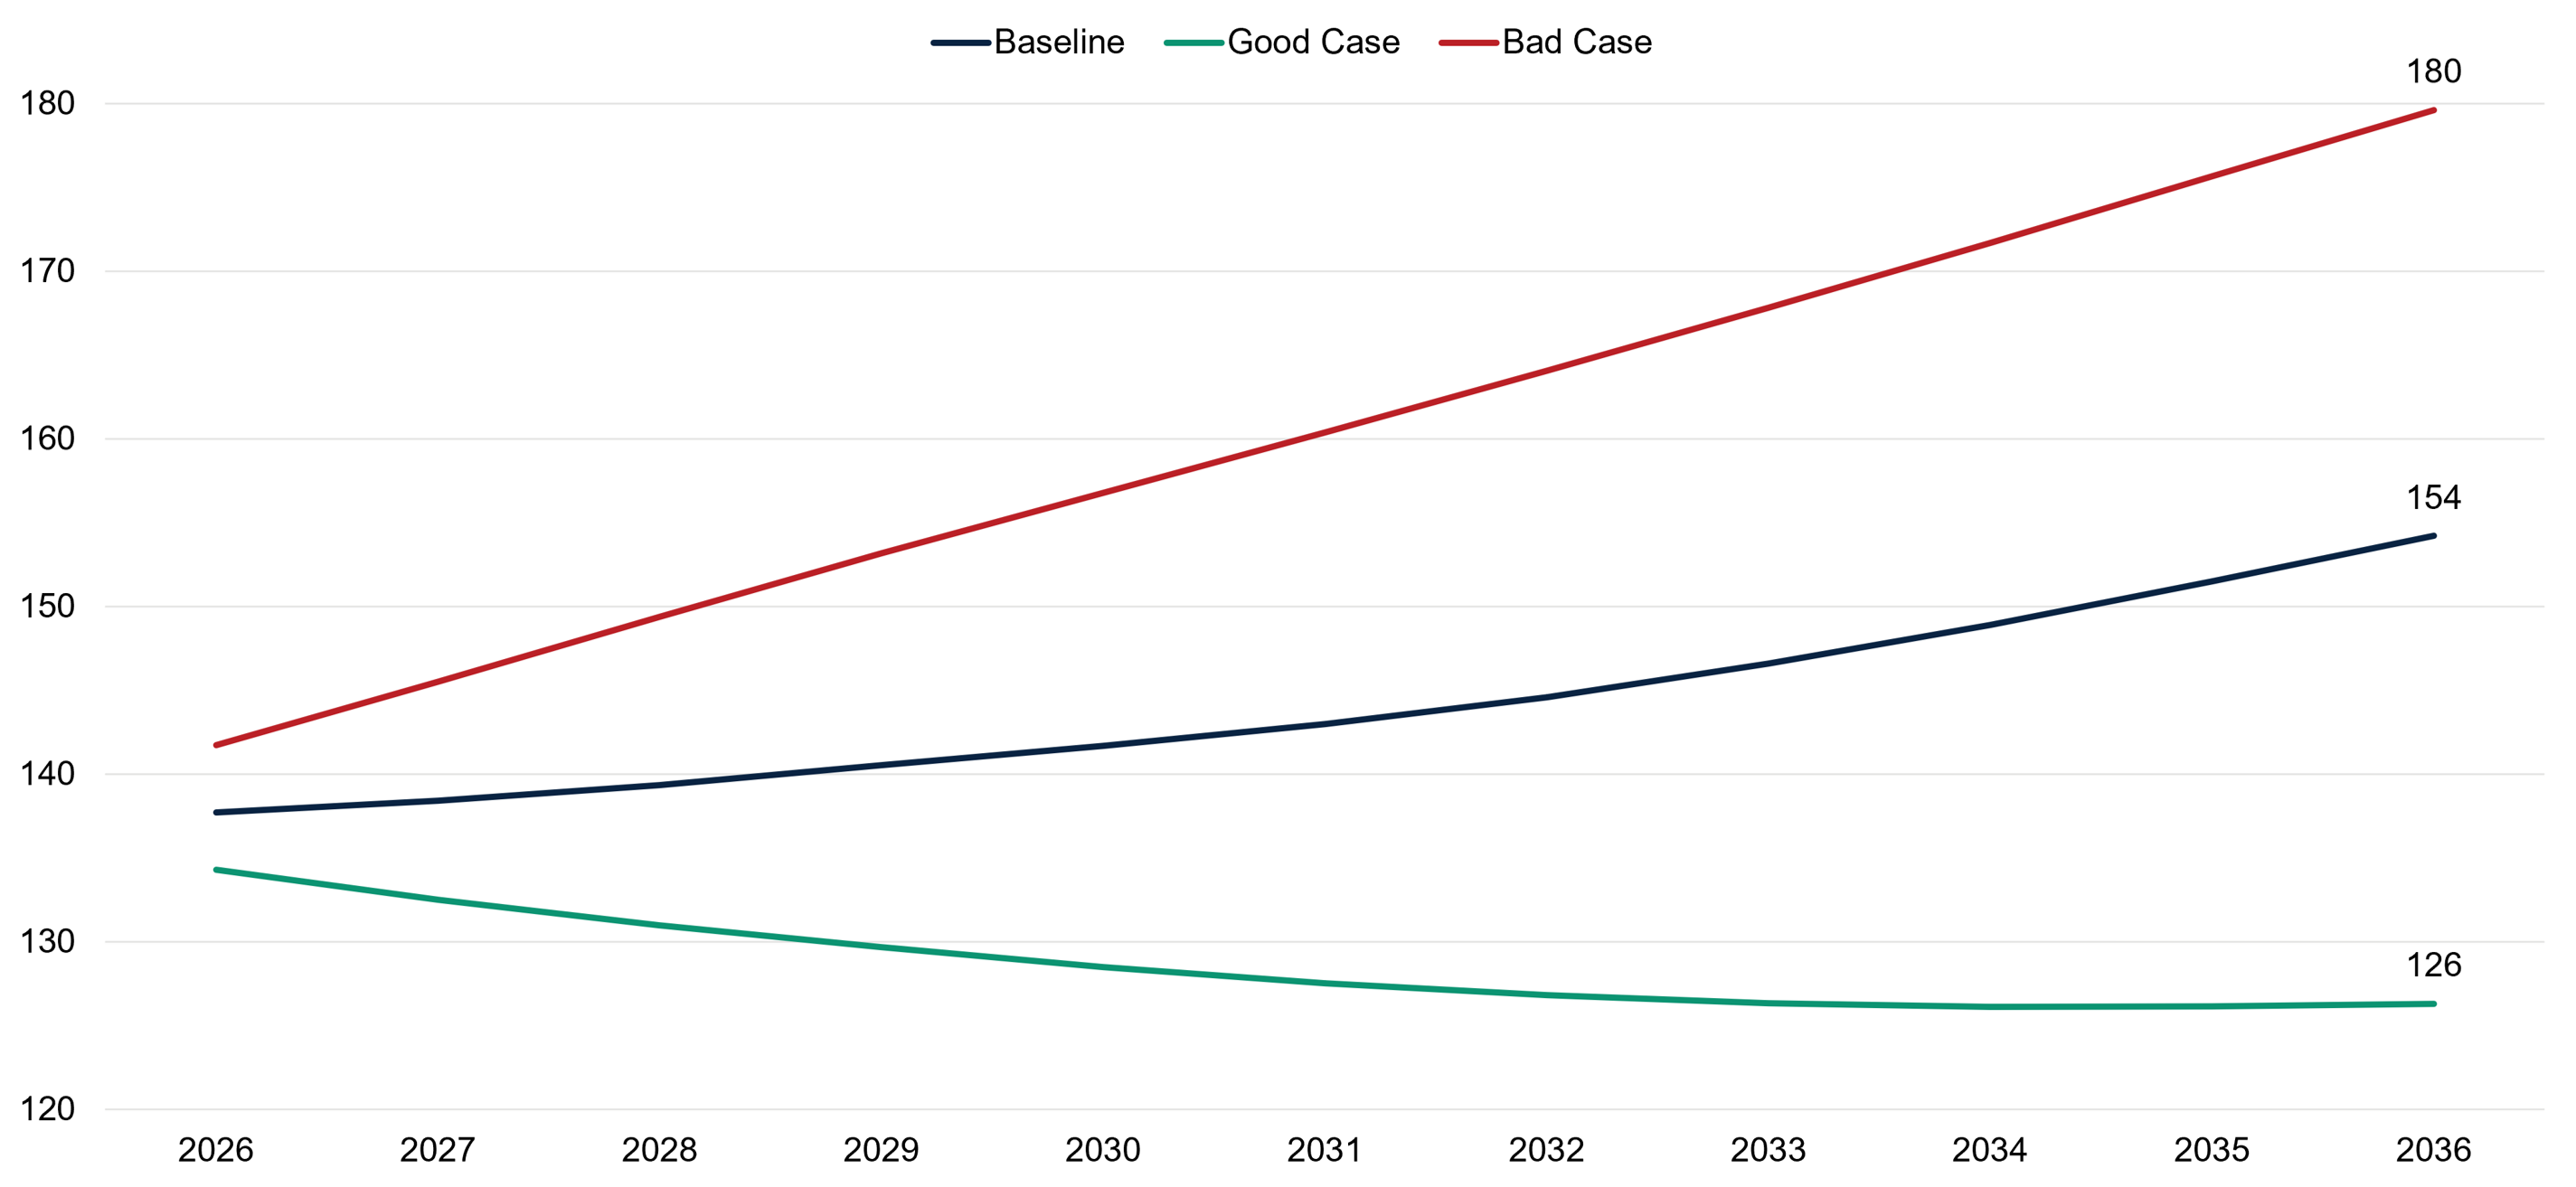
Figure 3

Total national debt (% of GDP)


Source: The Conference Board, 2026

Under the baseline scenario, the national debt as a percentage of GDP slowly but steadily rises to reach 154% in 2036. The bad-case scenario shows the compounding effects of high deficits, in which the rise in debt to GDP is much steeper, leading to the national debt being 180% of GDP in 2036. While the total national debt also rises in the good-case scenario, the debt as a percentage of GDP decreases over time, settling at 126% of GDP in 2036. This result demonstrates the value of reducing deficits relative to the size of the economy.

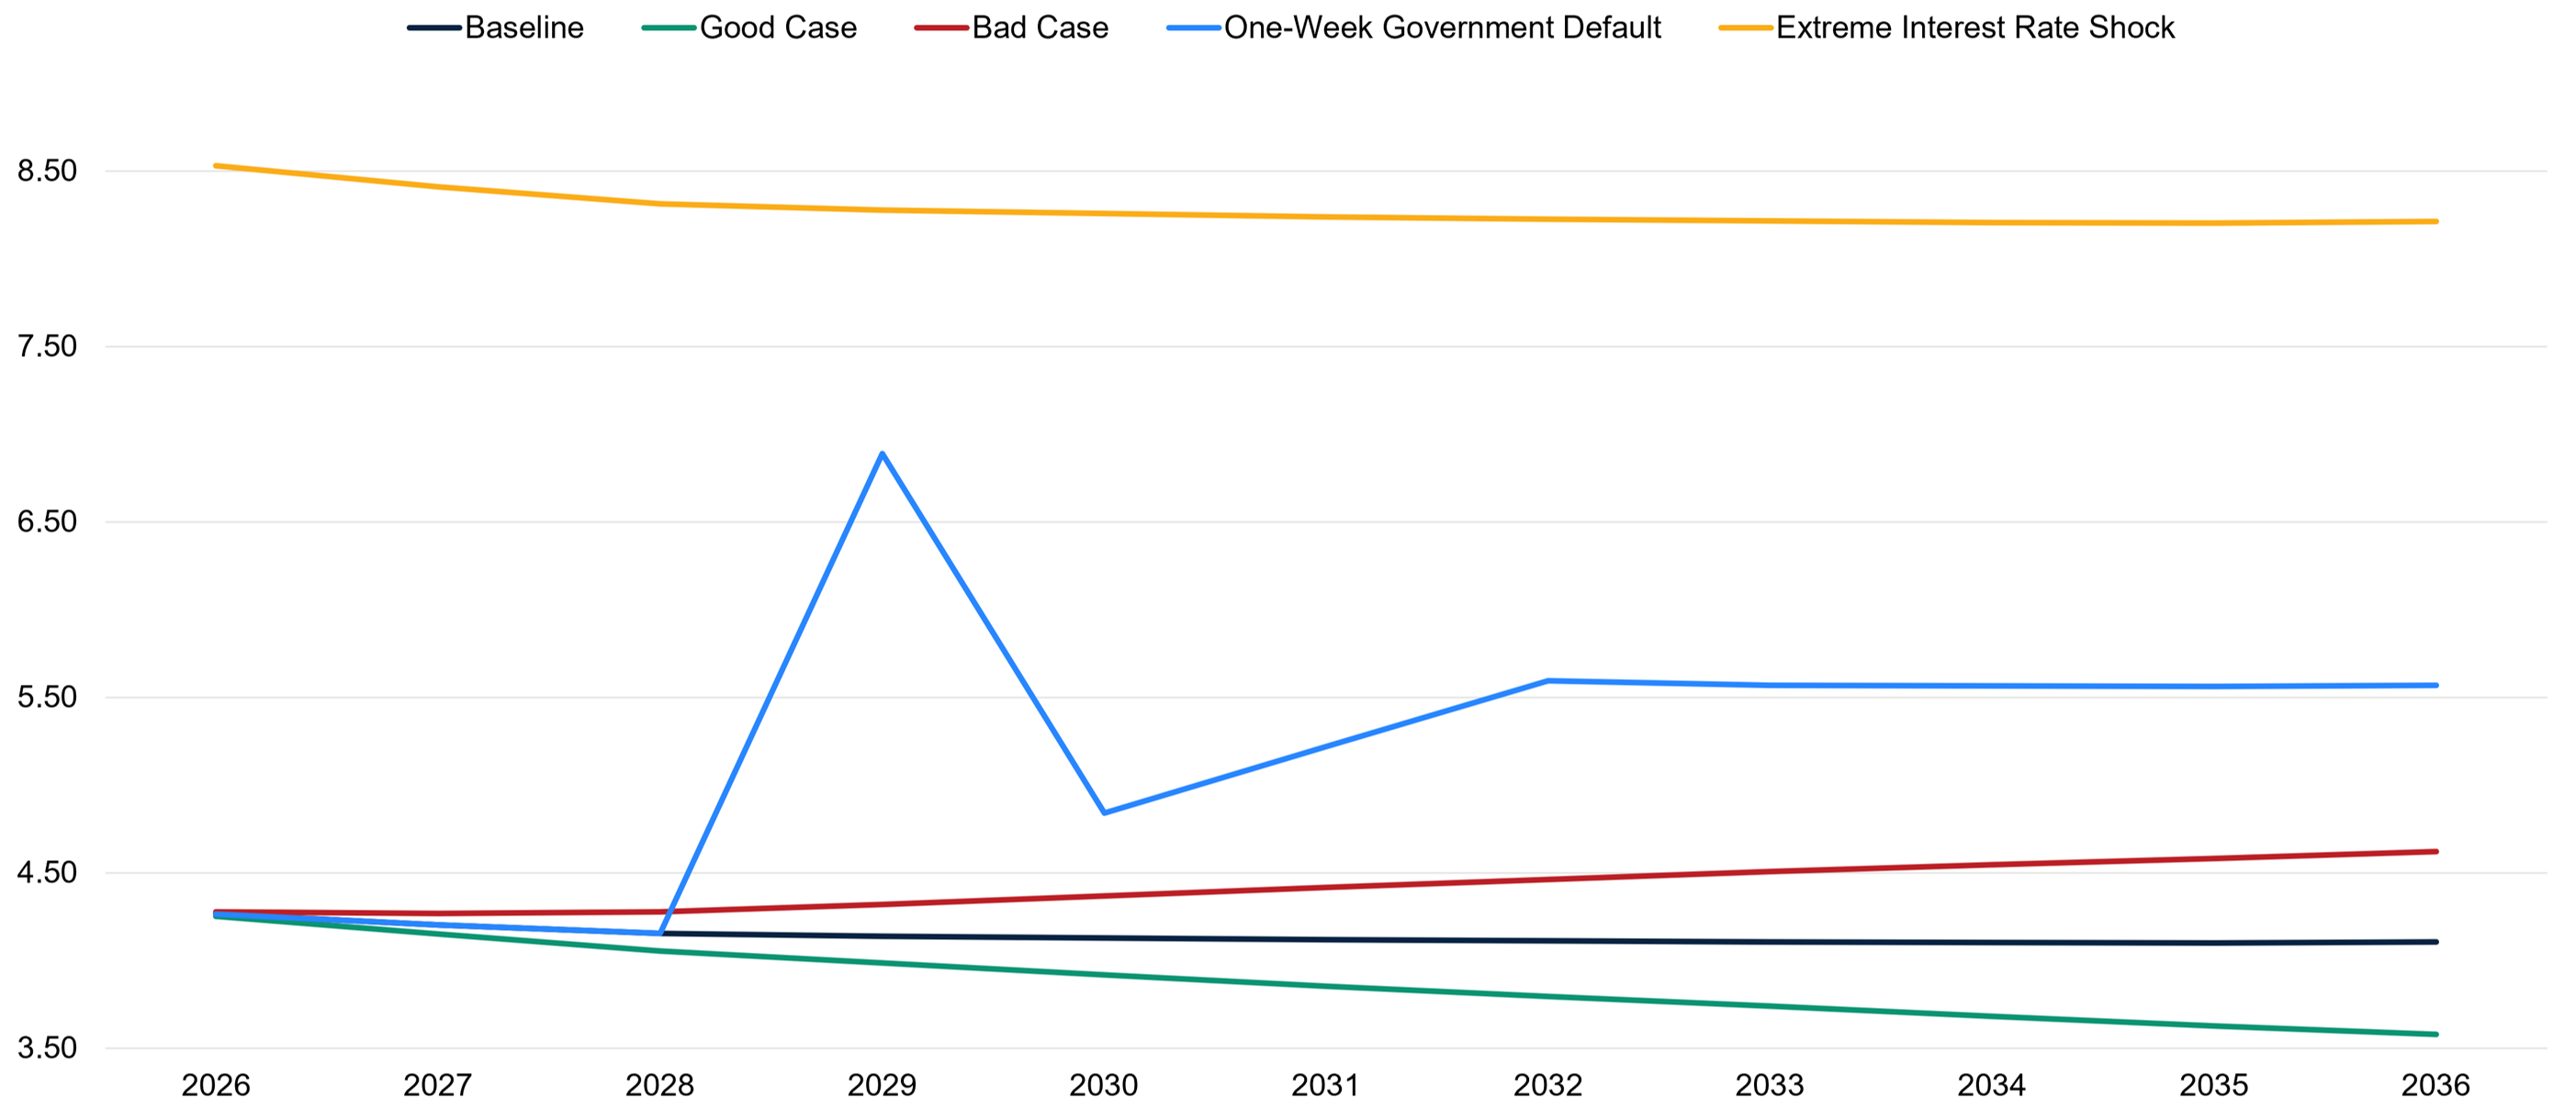
Figure 4

The effect of the national debt on interest rate of 10-year government bonds


Source: The Conference Board, 2026

Before bringing down these macroeconomic results to the individual level, it’s crucial to analyze the effect of the national debt on interest rates. The US government sells bonds of varying maturities, or investment lengths, to finance deficits. The interest rate for these bonds is set by financial markets, meaning that investors often demand higher interest rates when a government takes on more debt due to the higher risks (i.e., the more debt a country has, the less likely it is to pay back that debt). As a result, interest rates tend to rise with the debt.

Interest rates are a fundamental economic measure that supports many aspects of our standard of living. Debt and borrowing costs, if managed judiciously, can support growth through public investment. However, once rates become too high, they become a significant drag on the economy, not only by limiting government expenditures when they are needed for defense and social programs but also by making it more challenging for the private sector to invest and hire, undermining the economy. The growing use of leverage in the financial system means that many investments are now highly sensitive to interest rate changes, suggesting the full compounding effect of higher interest rates may be even higher than presented here.

The modeling nicely visualizes the effect of the debt on the interest rate for 10-year US government bonds. The baseline scenario shows a gradual decline in this interest rate, reaching approximately 4.1% in 2036. Acting on the deficit as in the good-case scenario produces an even steeper decline in the interest rate to 3.6% by 2036. When compared to GDP, the debt under the good-case scenario is stabilized; economic theory predicts that financial markets would reward this positive fiscal outlook with lower interest rates.

Conversely, high deficits in the bad-case scenario lead to an increase in the interest rate to 4.6% in 2036. The different trajectories for the interest rate on 10-year US government bonds will also affect the cost for the Federal government to finance future deficits. Economic theory predicts that more debt will make deficits more expensive with associated higher interest rates.

Finally, the one-week government default scenario results in a significant spike in the interest rate for 10-year US government bonds to 6.9% in 2029, followed by volatility for the next several years before the long-term interest rate settles around 5.6%. This is nearly one percentage point higher than the long-term interest rate in the bad-case scenario, demonstrating the catastrophic consequences of a US default on the national debt. The extreme interest rate shock’s interest rates of between 8.2% and 8.5% translate to higher national debt of about 1% of GDP compared to the baseline, reflecting the higher costs the US government faces in the high-interest rate environment.

Case Studies

The analysis so far has presented macroeconomic indicators for deficits, the national debt, and interest rates. But how do these broad factors affect Americans in their daily lives? In other words, why should Americans care about the national debt—and demand that policymakers act? The rising national debt will affect us all in different ways, requiring a look at different generations in their respective life stages and situations to parse the specific consequences of our unsustainable fiscal outlook. To illustrate the effect of the national debt on a variety of situations, the following case studies examine a student planning for college, a family of four, a future retiree planning for retirement, and a small business.

Student

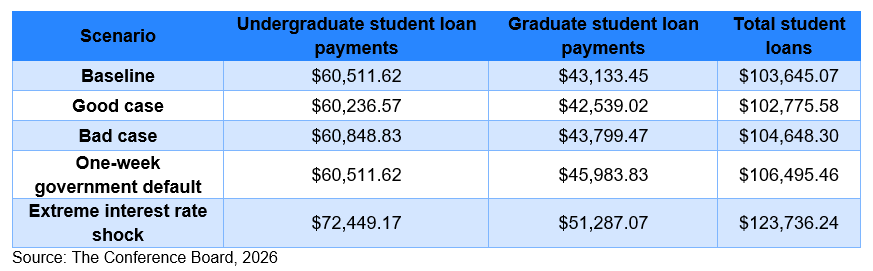
The first case study is a high school student planning to start undergraduate university studies in 2028. The student’s family will need to take out a $45,000 student loan to finance college. (The figure derives from adding an inflationary effect to the average student loan debt of $39,000 in 2025).10 The student also expects to attend a two-year graduate degree program in 2032, which would require another student loan of $30,000 at that time. The student will take out Federal student loans, which are tied to the 10-year Treasury yield with an additional fixed percentage of 2.05% for undergraduate loans and 3.6% for graduate loans.11 Under a standard 10-year repayment timeline, the student loan costs across the three scenarios are described below:

Table 1

Student loan costs

This case study demonstrates how the level of budget deficits affects student loan costs. Compared to the baseline scenario, reducing deficits under the good-case scenario leads to a 2.7% decrease in student loan payments (or a roughly $14,000 decrease). On the other hand, the bad-case scenario leads to a 3.2% increase in student loan payments compared to the baseline (or about a $16,000 increase). The one-week government default scenario causes an 8.7% (or about a $44,000) increase in student loan payments when compared to the baseline. The extreme interest rate shock has the most significant impact, increasing total student loan payments by nearly 61% (or about $310,000) over the baseline. As the deficit interacts with interest rates for government bonds, all types of loans will eventually be affected.

The differences in student loan costs are meaningful for younger Americans planning for college given the challenging environment for financing university studies. Young adults who go to college not only pay to attend but can also forgo income from employment to pursue their studies, setting them in the short-term behind their peers who enter the workforce immediately. Further, once a student graduates with an undergraduate and possibly also a graduate degree, the student enters the labor market facing a higher cost of living than today. Ideally, the benefit of education means that the student can command a higher salary in the labor market, but the student must also account for cost-of-living increases (and expected future salaries) in determining the amount of personal debt to assume in taking out a loan.

The student must also consider the overall environment for student loan debt. In the first quarter of 2026, Americans owed $1.87 trillion in Federal and private student loan debt, a 3.3% increase from the first quarter of 2025.12 After a period of low increases in total student loan debt between 2022 and 2024, the growth in total student loan debt accelerated in 2025.13 As of Q1 2026, more than 10.3% of student loans were 90 days or more delinquent, a significant increase from the level of 7.7% in Q1 2025.14 Over the past two decades, tuition costs have soared and recent graduates have struggled to find jobs after graduation during economic shocks like the 2008 financial crisis and the COVID-19 pandemic. Moreover, student loan debt is challenging to discharge via bankruptcy since borrowers must prove “undue hardship” from their loans in court, restricting flexibility to deal with financial emergencies.15 Thus, the projected differences in student loan costs could be the deciding factor in whether a student chooses to pursue going to college.

Family of four

The second case study involves a family of four with two parents, one young child, and one aging grandparent that requires caregiving. The family is saving for a down payment on a home to purchase sometime over the next decade to accommodate their family’s needs while also managing caregiving responsibilities for the child and grandparent.

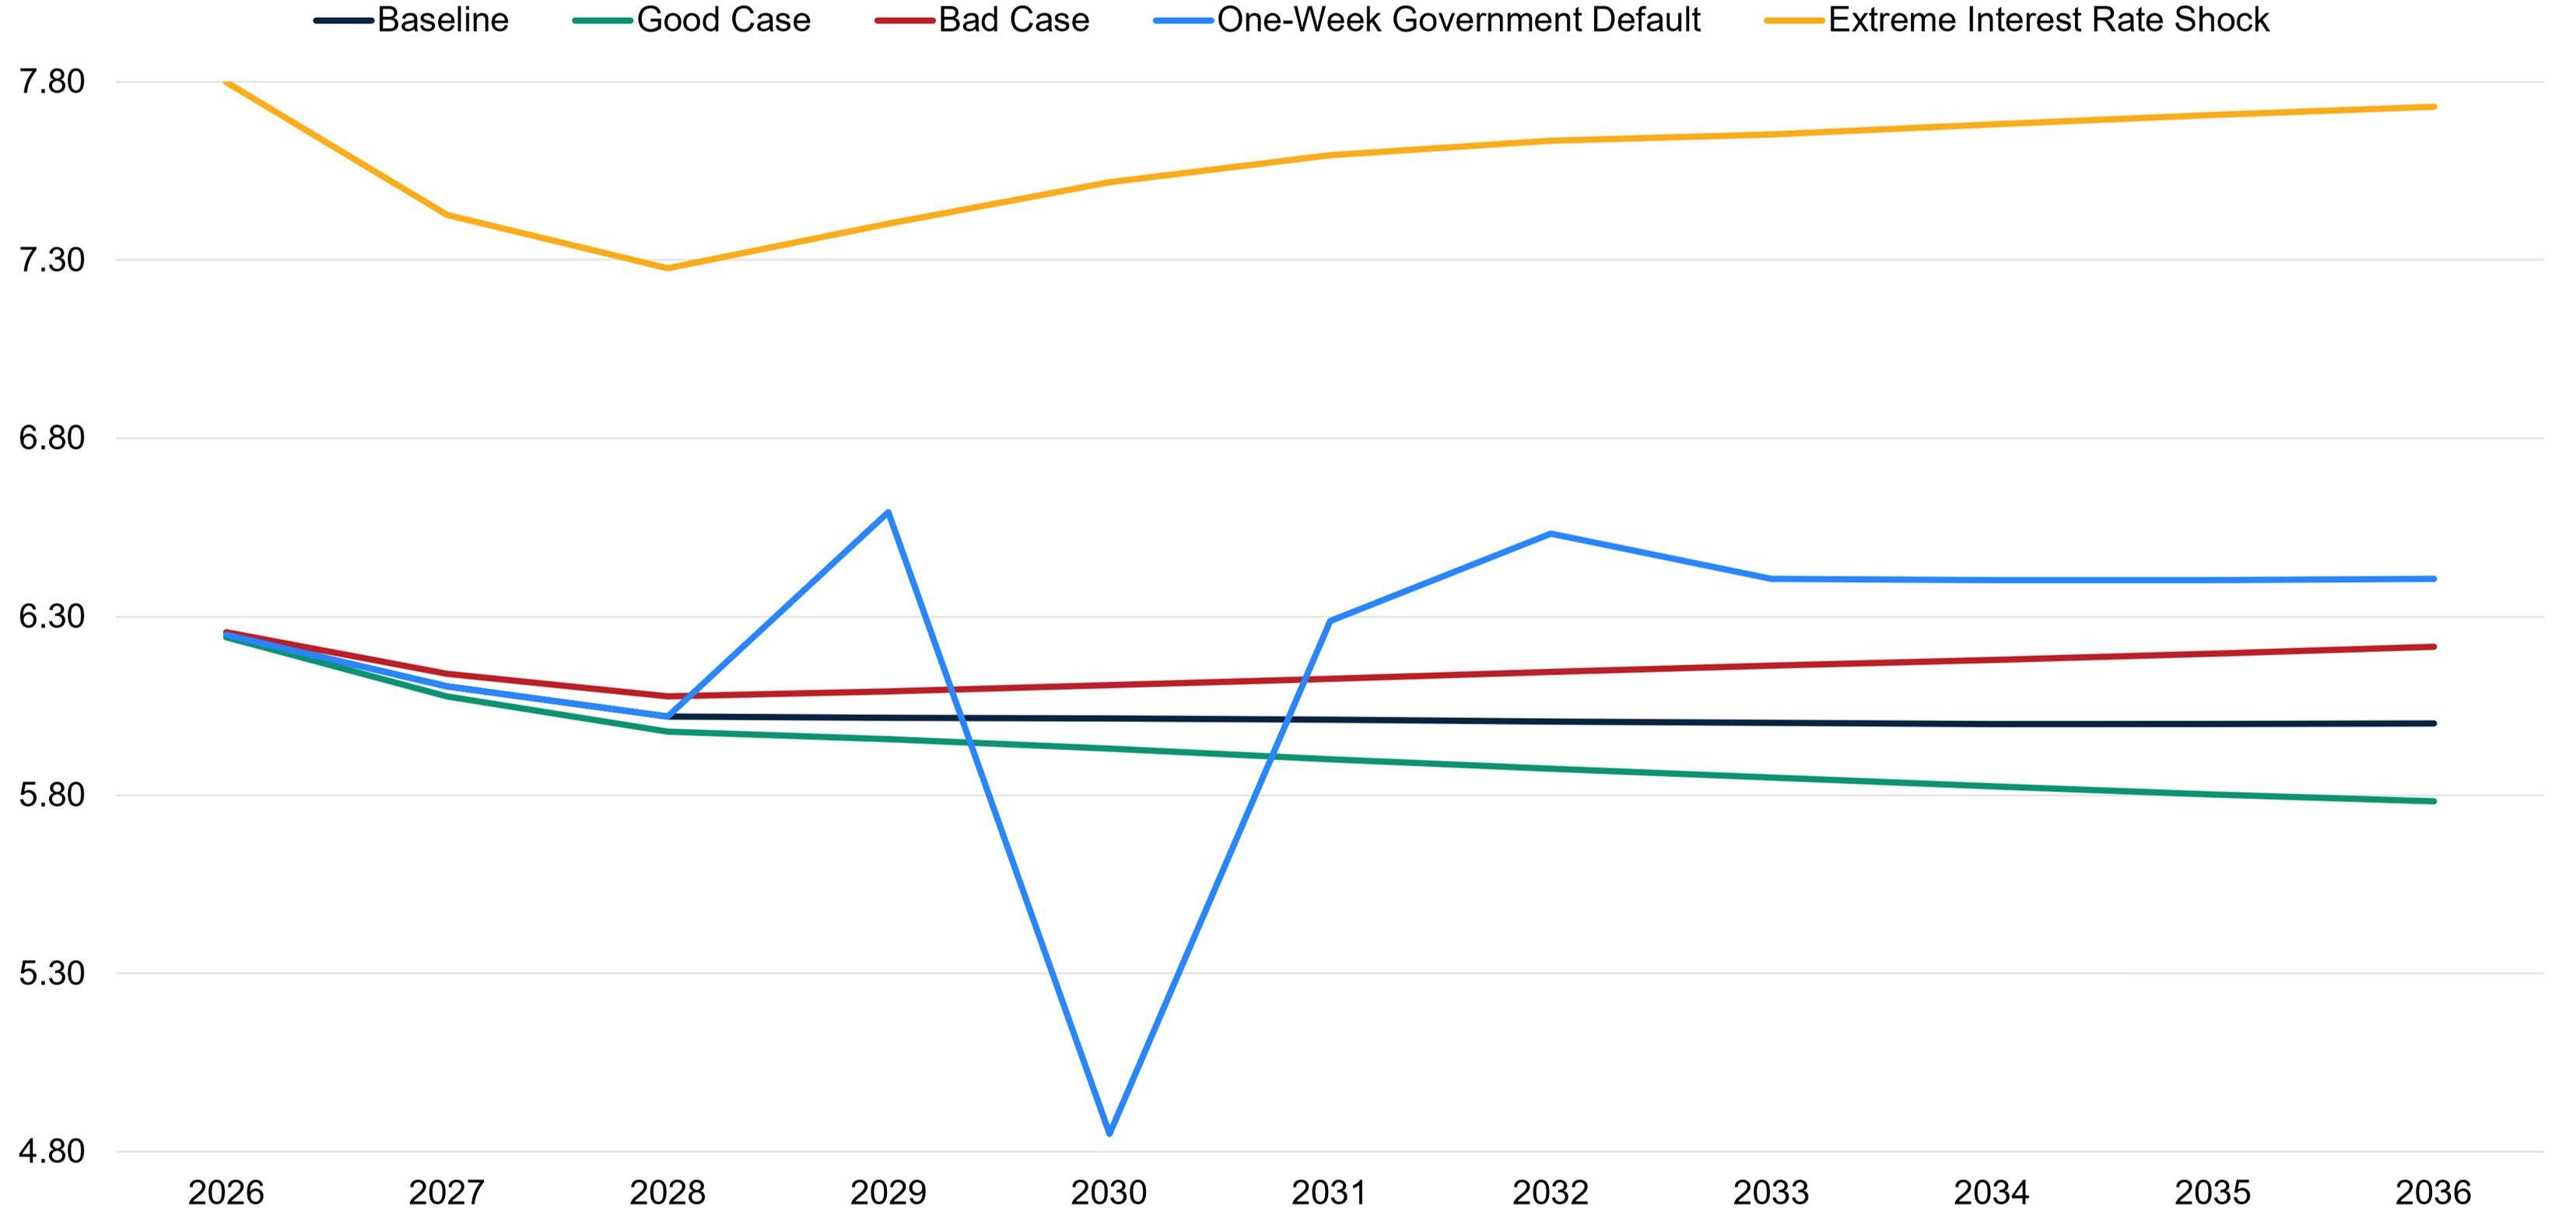
As the figure below shows, budget deficits and the national debt have a significant effect on mortgage rates. Mortgage rates in the baseline scenario drop significantly over two years before settling at around 6%. For the good-case scenario, the lower overall interest rates lead to an even bigger decline in the mortgage rate to less than 5.8%. However, the higher deficits in the bad-case scenario cause mortgage rates to increase after 2028 before reaching 6.2% in 2036. The mortgage rates under the one-week government default scenario exhibit extreme volatility in the years after the default in 2029, before settling at 6.4% in 2036. The doubling of interest rates in the extreme interest rate shock scenario passes through the rest of the economy, influencing mortgage rates. In that scenario, mortgage rates sharply increase to 7.8% in 2026, before decreasing slightly and rising again to reach 7.7% in 2036.

Figure 5

Interest rate on a 30-year fixed rate mortgage (%)


Source: The Conference Board, 2026

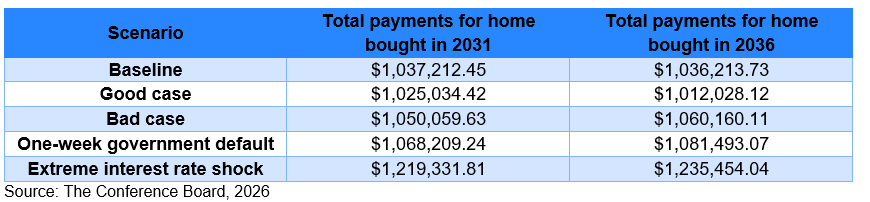
With these dynamics in mind, the family is saving to buy a house in either five or 10 years and is targeting a home worth $600,000 with a standard 30-year fixed-rate mortgage and a 20% down payment to avoid paying even higher rates. The following table presents the total mortgage payments for each scenario based on buying a home in five years (in 2031) or 10 years (in 2036):

Table 2

Mortgage costs for a family of four

Disparities in mortgage interest rates begin to emerge in five years. Compared to the baseline scenario, total mortgage payments under the good-case scenario would be approximately $53,000, or 1.8% lower. For the bad-case scenario, total mortgage payments would be approximately $55,000, or 1.9% higher than under the baseline scenario. The one-week government default results in higher total mortgage payments of $133,000, or 4.6% compared to the baseline scenario. As with previous case studies, the extreme interest rate shock scenario leads to total mortgage payments being $760,000, or 26.3% higher than the baseline, which was the most negative impact on this family.

As deficits continue to accumulate and further affect interest rates in the broader economy, the deficits amplify the disparities across the three scenarios over the subsequent five years. If the family waits to buy a home until 2036, the total mortgage payments in the good-case scenario would be more than $105,000, or 3.7% lower than in the baseline scenario. In the bad-case scenario, total mortgage payments would be nearly $103,000, or 3.6% higher than under the baseline scenario. For the one-week government default scenario, total mortgage payments would increase by $194,000, or 6.7% over the baseline scenario. The extreme interest rate shock scenario causes the largest increase in total mortgage payments—$829,000, or 28.8% higher than the baseline. These are meaningful differences for prospective homeowners given the recent rise in the delinquency rate of mortgage loans. The delinquency rate of 4.44% in Q1 2026 was up 18 basis points from Q4 2025 and up 40 basis points from one year prior.16 This case study demonstrates how the deficit indirectly affects housing affordability and the benefit of a responsible fiscal policy to addressing cost-of-living concerns.

It is crucial to put housing costs in context for this family of four. The parents face childcare costs for their child and long-term care costs for the aging grandparent as they navigate how to finance the down payment on their home and their decision on when to buy. Regarding childcare, the average annual price of center-based childcare in 2025 was $15,570.17 US childcare costs are rising 1.5 times faster than overall inflation as of September 2025.18 These rising costs led 70% of respondents in a 2025 survey to say raising children is too expensive, up 13 points from 2024, with finances the number-one reason families limit the number of children they have.19 Some parents are forced to quit work or cut their work hours to become caregivers for their children, particularly women and those in lower-income households.20

The costs of long-term care services show similar trends, with price increases for most types of care outpacing inflation in 2024.21 The annual median cost of a home health aide or homemaker services in 2024 was between $75,000 and $78,000. Assisted living community costs increased by 10% in 2024 to an annual median cost of $70,800. Nursing home costs also increased by 7–9% in 2024, with the annual median cost of a semi-private room in a nursing home rising to $111,000 and a private room rising to $128,000. Given uncertainty regarding future funding of public health programs including Medicare and Medicaid related to the deficit and debt, these costs could change with a potentially higher share of responsibility shifting from government to families. Beyond this, given these high costs for providing childcare and long-term care for the other members of their household, the parents in this family of four would greatly benefit from any policies that make their mortgage more affordable.

Future retiree

The third case study involves an older American rapidly approaching retirement. The 67-year-old American will retire in 2026 and begin collecting their full Social Security benefit then. Unfortunately, this retiree who relies on their Social Security benefits confronts an uncertain future for the Social Security program. The CBO projects that the primary Trust Fund for Social Security retirement benefits will become insolvent in 2032, meaning that the reserves in the fund will be exhausted that year.22 Congress will be faced with a choice to either let Social Security benefits equal the revenue coming into the program or backfill Social Security with General Fund from the Treasury to keep benefits steady.

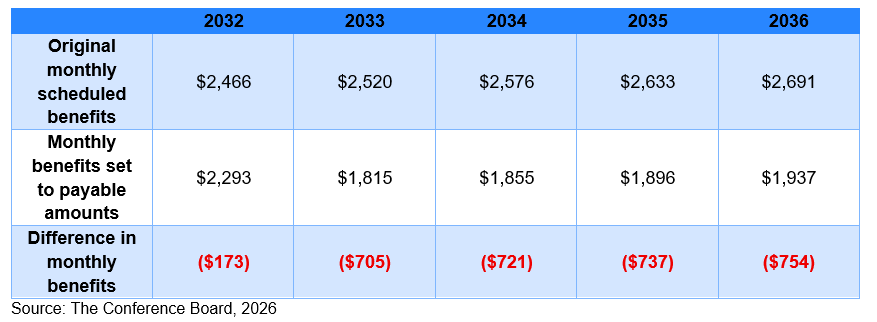
In the event that Congress chooses to let benefits equal payable amounts from the Trust Fund, individuals who obtain Social Security retirement benefits face a cut of 7% in 2032 and an average of 28% annually from 2033 to 2036, according to CBO’s latest projections. Assuming a monthly retirement benefit of $2,100 in 2026 (the average monthly retirement benefit for retired workers was $2,081 in April 202623), the retiree expects the original scheduled monthly retirement benefits below for 2032 through 2036. Assuming monthly benefits equal to payable amounts from the Trust Fund, the retiree faces a monthly benefit cut of $173 in 2032 and more than $700 in subsequent years.

Table 3

Monthly Social Security benefits as Trust Fund faces insolvency

If Congress decides to backfill the primary Social Security Trust Fund with money from the General Fund to preserve full scheduled benefits, the CBO estimates the funding needed to compensate for the anticipated reduction in Social Security retirement benefits post insolvency would amount to $2.7 trillion between 2032 and 2036. Backfilling some or all of this amount would directly increase the deficit absent additional revenue, leading to (or even accelerating) the precise dynamics present in the bad-case scenario with higher interest rates and costs for consumer loans.

Many older Americans face a challenging financial picture. The average retirement age is 62 in the US, an increase of five years since 1991.24 The expected retirement length also increased from 12.8 years to 18.6 years for men and from 16.6 to 21.3 years for women since 1970, putting pressure on workers to save even more for retirement. Social Security forms a core part of annual income for retirees, with 87% of eligible households obtaining Social Security benefits in 2023.25 Faced with impending reductions in Social Security benefits because of the Trust Fund’s projected insolvency, retirees must rely on other sources of income to compensate or cut spending. For those not yet in retirement, workers are making steady contributions to employer-sponsored retirement accounts and IRA accounts, whose balances experienced between 7% and 13% growth in 2024 tied to these contributions and market performance.26 Unfortunately, a record share of Americans are taking out hardship withdrawals from their retirement savings to cover emergency expenses, with (for example) 6% of individuals enrolled in Vanguard 401(k) plans making hardship withdrawals in 2025 compared to 5% in 2024.27

Health care costs for retirees are another important financial concern during retirement. Medicare also faces a projected insolvency in its Trust Fund within the next seven years, leading to reductions in government payments for Medicare health plans or a backfill from the General Fund to keep contributions steady. Total per capita out-of-pocket expenditure for health care has steadily grown over the past 50 years (even accounting for inflation), reaching $1,632 in 2024.28 While out-of-pocket costs for Medicare vary between Traditional Medicare and across Medicare Advantage plans, Medicare beneficiaries spent an average of $7,295 out-of-pocket in 2021.29 The medical expenses of Medicare beneficiaries also more than double between ages 70 and 90, putting pressure on retirement savings to cover out-of-pocket expenses in these later years.30 In a 2021 survey, 37% of Americans aged 65+ reported concerns with affording health care services, with 15% of respondents stating health care costs are a major financial burden for them.31 These concerns led 12% of Americans aged 65+ to avoid seeking treatment for a health problem and 24% to reduce spending on other needs including clothing, over-the-counter drugs, food, and utilities.32

Small business

The final case study is a small business looking to expand over the next decade. The owner has made a financial plan that requires two small business loans of $100,000 in five years and $150,000 in 10 years. The owner has a good relationship with their bank, and the bank is willing to offer an interest rate of the 10-year Treasury yield in the year the loan originated plus a 2% premium. As is common practice, each loan will be for 10 years to match the maturity of the government bond.33

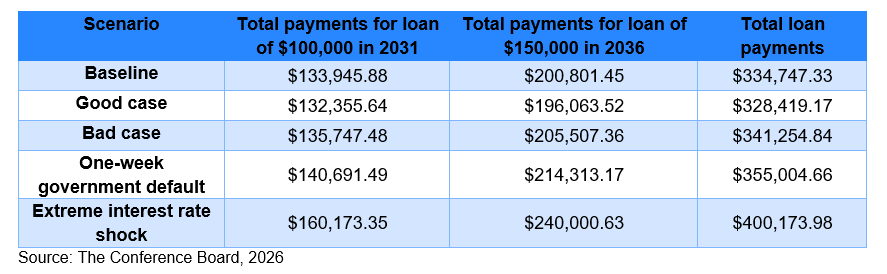
The following table shows the total cost of the loans under each scenario:

Table 4

Total cost of small business loans

As with student loans and housing, the deficit’s effect on interest rates also impacts small businesses. Compared to the baseline scenario, the total loan payments under the good-case scenario are about $105,000, or 7% lower. Under the large deficits of the bad-case scenario, the total loan payments are about $107,000, or 7% higher than in the baseline scenario. The one-week government default scenario results in higher total loan payments of $329,000, or 21.6% compared to the baseline scenario. The doubling of interest rates in the extreme interest rate shock scenario produces the most impact, leading to higher total loan payments of $1,028,000, or 67.3% compared to the baseline. These are significant changes in the costs small businesses face to expand and invest under different fiscal outlooks. In addition, the small business owner could also have credit card debt (sensitive to movements in interest rates) or other types of credit arrangements for operational costs.

Small businesses are crucial for many local economies and comprise a significant percentage of employment. However, they currently face a highly uncertain economic and geopolitical environment, with changing tariff policies, rising energy prices tied to geopolitical conflicts, and labor supply shocks all combining to heighten uncertainty.34 Monthly surveys of small businesses in early 2026 showed that perceptions of uncertainty were well above their historical averages and optimism was below average.35 The data bear out these perceptions, with small business profitability falling 1.3% year-over-year in April 2026 because of slower sales tied to higher prices.36 Small business’ spending on gasoline grew by 31% year-over-year in April, demonstrating the significant pressure of energy costs on small businesses. Addressing the deficit would reduce the overall level of economic uncertainty and provide significant benefits for the economic engine of small business.

In response to rising delinquency rates during the COVID-19 pandemic, banks have tightened credit standards for small businesses, making it more difficult to take out a loan from a bank.37 As a result, small business owners may be forced to use credit cards to cover business expenses. In Q1 2026, American households held $1.25 trillion in credit card debt, a $70 billion increase from the previous year.38 While credit card loan delinquency rates have flattened since 2024, the current delinquency rate of 3% remains above pre-pandemic levels, suggesting households are struggling to manage previously accumulated credit card debt.39

How Policymakers Can Act to Address the Debt

The economic modeling—and the extrapolations of it to include real-world effects—demonstrate the urgency for policymakers to act to address our unsustainable fiscal outlook. The biggest drivers of the national debt are spending on Social Security benefits, major Federal health care programs, and net interest on the debt. The entire Federal budget, including mandatory spending and revenue, must be assessed through a comprehensive review, which a bipartisan fiscal commission can facilitate. The CEO Center has released a host of recommendations to improve the financial sustainability of Social Security, major Federal health programs, and other significant areas of the budget. When combined with budget process reforms, Congress and the President have ample options and opportunities to reset the trajectory of the national debt and counteract its negative effects.

Bipartisan fiscal commission in Congress

A bipartisan fiscal commission offers a structured, credible forum for lawmakers to put everything on the table and produce a package of reforms capable of stabilizing the nation’s finances before gradual erosion becomes genuine crisis.40 Establishing a bipartisan fiscal commission in Congress to address the debt crisis would not solve the problem overnight but it could break partisan logjams, focus both political parties on finding a solution, bring bipartisan credibility to reforms, and encourage public awareness and support.

The commission’s three primary strategic objectives should be to improve the long-term fiscal condition of the Federal government, hold the expected debt-to-GDP ratio to a more sustainable level (such as 100%), and address the long-term solvency of the Social Security and Medicare Trust Funds. For a commission to be successful, everything must be on the table. The commission should undertake a top-to-bottom review of all Federal spending and revenue sources. To avoid losing political momentum, the law establishing the commission should include strict timelines and commitments for votes on the House and Senate floor.

Following enactment, Congress should adopt strong enforcement mechanisms for future fiscal decisions to avoid altering the new fiscal trajectory. The American people must also understand the stakes. A public education campaign should explain the fiscal crisis, invite broad input, and build the political will needed for Congress to act. This effort should focus especially on groups most vulnerable to a debt crisis—younger generations, lower-income communities, and the “sandwich” generation.

Social Security

Regarding Social Security, lawmakers must address the short-term projected insolvency of the primary Trust Fund while also setting up the program for long-term solvency that better matches annual income and benefit payments.41 Since few reform options can fully address Social Security’s projected shortfall, Congress should consider a comprehensive package of reforms, which the bipartisan fiscal commission can facilitate.

Potential benefit adjustments to consider include gradually raising the full retirement age to 69, implementing modest additional means testing for high-income beneficiaries, using alternative annual cost-of-living adjustments to index Social Security benefits, and removing work disincentives for retirees. On the revenue side, Congress should consider gradually raising the maximum earned income subject to the payroll tax to cover 90% of earned wages or eliminating it entirely.

Congress may also explore the pros and cons of diversifying Trust Fund investments beyond Treasury securities to boost income on reserves (and considering the impact of this change on the market for Treasury securities), reinvesting dividends and interest over a long-term period. It’s important to protect vulnerable populations of retirees by increasing the minimum benefit to protect low-wage workers and those with intermittent careers and by adjusting the schedule of reforms to provide Americans approaching retirement age adequate time to adjust their retirement planning.

Major federal health programs

For the major Federal health programs of Medicare, Medicaid, and subsidies for health plans purchased through the Affordable Care Act, Congress has multiple opportunities to modernize these programs to promote fiscal sustainability and quality.42 Lawmakers should work collaboratively with the Centers for Medicare and Medicare Services (CMS) and health care providers to achieve the broad transformations needed to set Medicare and other Federal health programs on a more sustainable fiscal path.

Congress should consider a comprehensive package of reforms to address the impending financial insolvency of Medicare’s Trust Fund, which may include adjustments to premiums, cost sharing, and prescription drug payments. CMS should continue its implementation of value-based care and alternative payment models, including greater use of accountable care organizations. Congress, CMS, and health care providers should make upfront investments in workforce and data infrastructure to implement value-based care and alternative payment models effectively and efficiently.

Congress should evaluate and reform the payment methodology for Medicare Advantage plans to affirm that the plans are generating savings for the Medicare program and delivering value and high-quality care to enrollees in Medicare Advantage. Congress, CMS, and health care providers should also emphasize primary care and care coordination to improve health outcomes and achieve savings in the long term. The Administration and Congress should assess strategies to streamline regulations and payment policies that add costs and administrative burdens to the health care system.

Budget process reforms

While the bipartisan fiscal commission can provide a venue to reset the nation’s fiscal trajectory, Congress should also implement budget process reforms to restore a predictable and fair process, and prevent the late and incomplete budgets that have characterized recent decades.43 These reforms should ideally be part of a comprehensive reform package. Congress may consider these options either through reforms to rules via legislation or through the bipartisan fiscal commission.

The first set of reforms improves timeliness. One option is to require lawmakers to pass a budget on time by prohibiting legislation with any fiscal effect from being considered until a budget is passed. Congressional leadership may prevent Members of Congress from leaving for scheduled recesses to enforce this requirement (with exceptions for genuine emergencies). Congress may also consider moving from an annual budget process to a biennial one (respecting the rule that one Congress cannot bind a future Congress), which can include a two-year budget resolution, two-year appropriations, and/or multiyear authorizations of programs.

The second set of reforms mitigate dysfunction and challenges to regular order. Congress should strengthen budget enforcement mechanisms, including enforcing pay-as-you-go statutes, capping increases in discretionary spending, and utilizing sequestration as a last resort. Congress should also consider reforms to the debt limit, including automatic increases if fiscal targets in the budget resolution are met or requiring a debt limit increase or suspension vote with any legislation with a significant fiscal effect. Congress may also consider automatic continuing resolutions at the start of a fiscal year if it has failed to pass the budget on time.

Finally, Congress should also incorporate longer-term planning into the process. One path is to extend the time horizon for CBO baseline budget projections from 10 years to 25 years and require the CBO to assess the long-term impact of budget proposals and include interest costs in all scoring. Congress may also require statutory medium- and long-term targets for regular appropriations and for the national debt as a share of GDP, with the goal of reducing the national debt to a more sustainable 70% of GDP.

A better-functioning appropriations process will allow Congress and the President to consider reforms to other significant areas of the budget, such as Medicaid,44 the Department of Agriculture,45 and the Department of Veterans Affairs.46 By comprehensively assessing the budget, Congress and the President have an opportunity to reset our negative fiscal trajectory and put the country’s finances on a sustainable path forward.

Conclusion

The national debt is a tangible issue that already affects us all, with higher deficits leading to higher interest rates and higher costs for student loans, mortgages, and business loans. Neglecting the problem will not make it better and worsening our deficits will only increase the negative impacts of the debt on the rest of the economy. As this analysis has shown, reducing our deficits to a more sustainable level stabilizes the national debt as a percentage of GDP and produces positive savings for students, families, retirees, and businesses. Addressing the national debt deserves to be a high priority for both voters and lawmakers, to benefit all Americans.
Endnotes


  1. David K. Young, America’s $38 Trillion Debt Crisis Is Already Here. The Reckoning Comes Next, Fortune, March 17, 2026.
  2. Yelena Shulyatyeva, Global Economic Outlook 2026: US Edition: Transformation Amid Slower Growth, The Conference Board, December 8, 2025.
  3. Sylvester C.W. Eijffinger and Bilge Karatas, Three Sisters: The Interlinkage Between Sovereign Debt, Currency, and Banking Crises, Journal of International Money and Finance, Volume 131, March 2023.
  4. Congressional Budget Office, Introduction to CBO, June 2026.
  5. Congressional Budget Office, The Budget and Economic Outlook: 2026 to 2036, February 11, 2026.
  6. Board of Governors of the Federal Reserve System and FRED, Market Yield on U.S. Treasury Securities at 10-Year Constant Maturity, Quoted on an Investment Basis (DGS10), August 3, 2026.
  7. Congressional Budget Office, 10-Year Budget Projections, April 2018.
  8. White House Office of Management and Budget, Analytical Perspectives: 4, Federal Borrowing and Debt, February 12, 2018.
  9. Congressional Budget Office, Historical Budget Data, February 2026.
  10. Melanie Hanson, Average Student Loan Debt, Education Data Initiative, August 15, 2025.
  11. Ben Luthi, How the Federal Reserve's Rate Decision Impacts Student Loan Interest Rates, Yahoo! Finance, May 21, 2026.
  12. Matt Schulz, Student Loan Debt Statistics, LendingTree, June 2026.
  13. Hanson, Student Loan Debt Statistics.
  14. Matt Schulz, Student Loan Debt Statistics, LendingTree, June 2026.
  15. Council on Foreign Relations, Is Rising Student Debt Harming the US Economy?, April 16, 2024.
  16. Mortgage Bankers Association, Mortgage Delinquencies Increase in the First Quarter of 2026, May 14, 2026.
  17. First Five Years Fund, NEW: “High Cost of Childcare Shapes Families’ Choices and Futures”, November 18, 2025.
  18. Bank of American Institute, The Many Costs of Childcare, October 28, 2025.
  19. First Five Years Fund, NEW: “High Cost of Childcare Shapes Families’ Choices and Futures.”
  20. Bank of American Institute, The Many Costs of Childcare.
  21. Genworth, Genworth and CareScout Release Cost of Care Survey Results for 2024, March 4, 2025.
  22. Molly Dahl, Testimony on Social Security's Finances, Congressional Budget Office, March 25, 2026.
  23. Social Security Administration, Monthly Statistical Snapshot, April 2026, May 2026.
  24. Guardian, The Average Retirement Age in the US, July 17, 2025.
  25. Jennifer Clendening and Jun Ho Phue, More US Residents Are Working Past Retirement Age, Pew, August 4, 2025.
  26. Spencer Feingold, Americans' Retirement Accounts—and Hardship Withdrawals—Hit New Highs. Here's What to Know, World Economic Forum, March 11, 2026.
  27. Megan Cerullo, A Record Share of Americans Are Taking Emergency Withdrawals from Their 401(k)s, CBS News, March 5, 2026.
  28. Shameek Rakshit, et al., How Has US Spending on Health Care Changed Over Time?, Peterson-KFF Health System Tracker, January 22, 2026.
  29. AARP, Traditional Medicare Beneficiary Out-of-Pocket Costs, June 2026.
  30. Mariacristina De Nardi, et al., Medical Spending of the US Elderly, NIH National Library of Medicine National Center for Biotechnology Information, accessed June 5, 2026.
  31. Nicole Willcoxon, Older Adults Sacrificing Basic Needs Due to Health Care Costs, Gallup, June 15, 2022.
  32. Willcoxon, Older Adults Sacrificing Basic Needs Due to Health Care Costs.
  33. Caleb Quakenbush and Julia Pelletier, Why the National Debt Matters for the US Bond Market and the Economy, Bipartisan Policy Center, April 16, 2025.
  34. John Schroyer, As Corporate Profits Surge, America’s Small Businesses Get Left Behind, Forbes, June 2, 2026.
  35. National Federation of Independent Business, Small Business Optimism Index (April 2026), accessed June 5, 2026.
  36. Bank of America Institute, Small Business Checkpoint: A Roadmap Across the Country, May 19, 2026.
  37. Board of Governors of the Federal Reserve System, Financial Stability Report - November 2025: 2. Borrowing by Businesses and Households, November 25, 2025.
  38. Federal Reserve Bank of New York, Household Debt Balances Rise Slightly as Delinquency Transition Rates Hold Steady, May 12, 2026.
  39. Federal Reserve Bank of New York, Household Debt Balances Rise Slightly as Delinquency Transition Rates Hold Steady.
  40. The Committee for Economic Development, A Bipartisan Fiscal Commission to Tackle the National Debt, The Conference Board, February 17, 2026.
  41. The Committee for Economic Development, Saving Social Security, The Conference Board, February 12, 2024.
  42. The Committee for Economic Development, Modernizing Health Programs for Fiscal Sustainability and Quality, The Conference Board, November 18, 2024.
  43. The Committee for Economic Development, Reforming the Broken Federal Budget Process, The Conference Board, February 24, 2025.
  44. The Committee for Economic Development, Explainer: Medicaid, The Conference Board, August 25, 2025.
  45. The Committee for Economic Development, Explainer: Department of Agriculture Funding and Opportunities for Reform, The Conference Board, December 17, 2025.
  46. The Committee for Economic Development, Explainer: Veterans Programs and the Budget, The Conference Board, September 17, 2025.

The national debt is often discussed in terms of trillions of dollars, budget projections, and other macroeconomic measures that feel distant from everyday life. Yet the consequences are not abstract. Rising debt affects the cost of borrowing, economic opportunity, and financial security for Americans of all ages. Without a clearer understanding of these impacts, public concern remains muted and policymakers face less pressure to act.

This report makes the issue tangible. It models five fiscal paths—a baseline scenario, a deficit-reduction scenario, a higher-deficit scenario, and two global financial shocks—and examines their effects on the national debt and interest rates. It then brings those outcomes to life through case studies of a student, a family of four, a future retiree, and a small business owner.

Trusted Insights for What’s Ahead®

  • High levels of debt require the Federal government to spend more on interest payments, leaving fewer resources available for other priorities. If investors begin to view US debt as riskier, interest rates could rise further, increasing private sector borrowing costs for expansion, hiring, and investment.
  • Compared to the baseline scenario, reducing the deficit leads to a relatively flat national debt as a percentage of GDP and produces lower interest rates. Increasing the deficit compared to the baseline significantly increases the debt-to-GDP ratio and causes increases in the interest rate for government bonds. A global financial shock in the form of a week-long default of the US government debt in 2029 causes a significant spike in interest rates, near-term economic volatility, and a higher level of interest rates in the long term. An economic shock where interest rates double from the baseline filters throughout the economy, significantly raising mortgage rates and other costs.
  • The differences in interest rates lead to meaningful outcomes over the next decade for Americans, particularly Americans living under tight budgets. Under the scenario in which deficits are lower compared to the baseline, student loan costs decreased by 2.7%, housing costs between 1.8% and 3.7%, and small business loan payments by 7%. Conversely, increasing deficits over the baseline leads to student loan costs increasing by 3.2%, housing costs between 1.9% and 3.6%, and small business loan payments by 7%. The one-week government default leads to student loan costs increasing by 8.7%, housing costs between 4.6% and 6.7%, and small business loan payments by 21.6%. The extreme interest rate shock increases student loan costs by 61%, housing costs between 26% and 29%, and small business loan costs by 67%.
  • The primary Trust Fund for Social Security retirement benefits will become insolvent in 2032, according to the Congressional Budget Office (CBO). Assuming monthly benefits equal to payable amounts from the Trust Fund, a future retiree collecting a monthly retirement benefit of $2,100 faces a monthly benefit cut of $170 in 2032 and more than $700 in subsequent years, per CBO estimates.
  • These numbers can have profound impacts on the decisions of many individual Americans whether to attend college and when to form a family, purchase a home, or build a business.

Policy Recommendations

To address our unsustainable national debt, policymakers should consider the following recommendations:

  • Establish a bipartisan fiscal commission in Congress to improve the long-term fiscal condition of the Federal government, hold the expected debt-to-GDP ratio to a more sustainable level (such as 100%), and address the long-term solvency of the Social Security and Medicare Trust Funds.
  • Save Social Security to avoid short-term insolvency and establish long-term fiscal sustainability through a combination of benefit adjustments, revenue raisers, and considering diversification of Trust Fund investments.
  • Modernize Medicare and other major Federal health care programs through innovative strategies, including value-based care and alternative payment models; reforms to Medicare Advantage; adjustments to premiums, cost sharing, and prescription drug payments; an emphasis on primary care and care coordination; and streamlined regulations.
  • Reform the broken Congressional budget process by implementing comprehensive solutions that improve timeliness throughout the process, mitigate challenges to regular order, permit greater debate on important topics, and incorporate longer-term planning into budget development.

Why Is the National Debt a Problem?

America does not look like a nation in fiscal distress—and that’s exactly the problem.1 The S&P 500 has more than doubled in the past five years. Unemployment (U-3) is at a multidecade low. Social Security checks are going out. But these surface-level indicators hide deeper vulnerabilities. The national debt is on track to reach levels never seen outside of wartime—projected to climb to roughly 120% of GDP within the next decade. That means that the Federal government would owe 20% more than the entire annual output of the US economy.

That trajectory will not trigger an alarm bell overnight. As Ernest Hemingway wrote, bankruptcy happens “gradually and then suddenly.” The same can be true of fiscal decline. The US has over $39 trillion of national debt. We now spend more annually on interest on that debt than on defense. The primary Trust Funds for Social Security and Medicare are also projected to become insolvent within the next seven years, requiring automatic benefit cuts, payroll tax increases, sharp premium increases in the case of Medicare, or even more deficit spending to backfill these programs. These pressures will intensify as the population ages, health care costs rise, and economic growth slows.

That point is clear: economic growth alone will not address structural challenges in the budget. The Conference Board® forecasts that US growth is expected to slow for the remainder of the 2020s and the 2030s—the very period when the debt is projected to rise significantly—because of demographic headwinds and higher structural interest rates.2 Moreover, leaving aside the 2001 market downturn, the 2008 financial crisis, and the COVID-19 pandemic, the national debt has accumulated during a period of relative economic prosperity and strong gains in equity markets. This raises further alarm. Economic growth, of itself, is important but cannot be the sole solution.

In extreme cases, a country’s debt burden can become too heavy, leading to a sovereign debt default. Recent examples of these debt crises include the Tequila crisis in Mexico in 1994, the Russian financial crisis in 1998, the Asian financial crisis of 1997–98, and the Argentinian economic crisis of 2001–02.3 A debt crisis is often accompanied by a banking and/or currency crisis, affecting the country’s financial system, value of its national currency, and international trade. As interest rates soar amid the default, economic growth stagnates and faith in government and other institutions falters.

For American businesses, the looming debt crisis carries tangible, real-world consequences. High levels of debt require the Federal government to spend more on interest payments, leaving fewer resources available for infrastructure, education, national defense, and social programs. If investors begin to view US debt as riskier, interest rates could rise further, increasing borrowing costs for expansion, hiring, and investment.

All Americans will feel the effects of the debt crisis. Current retirees and those approaching retirement age (especially those with limited pensions and retirement savings) will be at risk of losing crucial income, health, and long-term care support. Younger generations will also have to bear the burden of reducing the national debt with less fiscal flexibility to address long-term, structural challenges. In short, the high national debt prevents us from investing fully in America’s future.

Nevertheless, it is not intuitive to translate broader macroeconomic effects into the debt’s tangible impacts on Americans. Discussions of astronomical figures in the trillions utilizing economic jargon are too abstract and removed from the lives of most Americans. For example, dividing the $39.7 trillion in total public debt outstanding by the US population of 342.7 million (as of July 2026) results in a debt burden of approximately $116,000 per American. But what does that actually mean for individuals?

The debt will also affect different generations of Americans in distinct ways, preventing a simple narrative or conclusion from emerging. This disconnect impedes the national debt from becoming a priority issue for voters, with voters understandably focusing on immediate and urgent issues that clearly affect them. Without a signal from voters that the debt is a priority, lawmakers will in turn not prioritize the difficult tradeoffs necessary to set our fiscal trajectory on a better path.

Debt Scenarios

To illustrate the microeconomic impacts of our unsustainable national debt, it is important to consider several scenarios regarding the annual budget deficit, which adds to the national debt. By studying the effects of reducing the deficit or letting it get further out of control, Americans can visualize the consequences of the national debt on their lives and financial decisions.

Overview

The modeling in this report utilizes The Conference Board’s model for forecasting economic growth and other macroeconomic variables. The modeling varies the annual deficit over a 10-year period across three scenarios: a baseline (debt is 6–7% of GDP), a “good” case (debt falls over time to 3% of GDP), and a “bad” case (debt rises to 9%). Based on the different annual deficits, the modeling then produces outputs of macroeconomic variables, such as the total national debt, GDP, and interest rates. From this, the model then estimates the impact on important life decisions such as taking out a student loan, purchasing a home, or building a small business (which could require taking out a small business loan).

For the baseline scenario, the modeling uses the latest budgetary projections from the CBO. CBO is an independent entity in Congress that provides objective, nonpartisan information to support the Congressional budget process and to help the legislative branch make effective budget and economic policy.4 In the CBO’s most recent 10-year budgetary projections, the Federal government runs an annual deficit of between 6–7% of GDP (which means the absolute deficit rises as the economy grows).5 

Figure 1

Annual deficit for each scenario ($ billion)

Source: The Conference Board, 2026

The good-case scenario assumes the Federal government reduces the annual deficit to 3% of GDP, cutting the baseline deficit by roughly half (the modeling is designed to produce a consistent scenario). This level of annual deficits still increases the total national debt, but it would help stabilize debt in relation to the size of the economy and represents a significantly improved fiscal outlook. The bad-case scenario assumes the baseline deficit grows by a similar magnitude, increasing the annual deficit to 9% of GDP. This scenario represents a significant worsening of the fiscal outlook and will demonstrate that it is also worthwhile for policymakers to prevent further deterioration of the deficit.

Finally, the modeling analyzes two additional scenarios to simulate global financial shocks: a week-long default of the US Federal government debt in 2029 (the year the current debt ceiling is projected to be reached) and an extreme interest rate shock where the interest rates in the baseline scenario double. The US has approached a default on its debt during debates in Congress on raising or suspending the debt ceiling in 2023 and 2025, as the US Treasury was forced to undertake extraordinary measures to prevent a default on the national debt. The extreme interest rate shock seeks to model the economic conditions of the 1980s, when the interest rate for 10-year US government bonds was regularly 8–15%.6 The modeling projects interest rates and mortgage rates under these global shock scenarios to demonstrate the enduring consequences of the associated economic turbulence (for purposes of modeling, the shock begins in 2026 and extends throughout the forecast period).

Analysis

Every year the Federal government runs a deficit, the national debt grows as the government must sell bonds to finance the gap between spending and revenues. The modeling demonstrates this crucial point, with the national debt naturally growing in all three scenarios. Larger deficits produce more national debt. The debt in 2036 under the bad-case scenario is more than 16% higher than in the baseline scenario. Action on reducing the deficit also produces positive results for the national debt, with the debt in the good-case scenario 18% lower than in the baseline scenario (but still growing).

It is important to note that budgetary projections from the CBO and the White House Office of Management and Budget (OMB) routinely understate the future level of debt. (The CBO is bound to accept a “current law” baseline as the foundation of its analysis). For example, in early 2018 the CBO projected the debt held by public at the end of 2025 to be $24.3 trillion, or 91.5% of GDP.7 In its 2018 President’s Budget release, OMB projected the debt held by the public in 2025 to be $22.1 trillion, or 78.4% of GDP.8 The actual debt held by the public in 2025 was $30.2 trillion or 99.4% of GDP, roughly $6 trillion–8 trillion (or 24–37%) higher than the CBO and OMB estimates in 2018.9 It is difficult to account for future interest rate levels, inflation, economic growth, and geopolitical events in budget projections. Nevertheless, this trend suggests that the modeling using the CBO’s baseline projections is likely a conservative estimate and the true level of future debt may be higher.

Figure 2

Total national debt (nominal, $ billion)


Source: The Conference Board, 2026

In analyzing the national debt, it is important to put the debt into context. A standard method to contextualize the debt is comparing it to GDP, the total annual economic output of the economy. This comparison gives a sense of a country’s ability to pay back its debt, along the lines of how a bank evaluates a person’s income and assets to assess whether to provide a loan.

Figure 3

Total national debt (% of GDP)


Source: The Conference Board, 2026

Under the baseline scenario, the national debt as a percentage of GDP slowly but steadily rises to reach 154% in 2036. The bad-case scenario shows the compounding effects of high deficits, in which the rise in debt to GDP is much steeper, leading to the national debt being 180% of GDP in 2036. While the total national debt also rises in the good-case scenario, the debt as a percentage of GDP decreases over time, settling at 126% of GDP in 2036. This result demonstrates the value of reducing deficits relative to the size of the economy.

Figure 4

The effect of the national debt on interest rate of 10-year government bonds


Source: The Conference Board, 2026

Before bringing down these macroeconomic results to the individual level, it’s crucial to analyze the effect of the national debt on interest rates. The US government sells bonds of varying maturities, or investment lengths, to finance deficits. The interest rate for these bonds is set by financial markets, meaning that investors often demand higher interest rates when a government takes on more debt due to the higher risks (i.e., the more debt a country has, the less likely it is to pay back that debt). As a result, interest rates tend to rise with the debt.

Interest rates are a fundamental economic measure that supports many aspects of our standard of living. Debt and borrowing costs, if managed judiciously, can support growth through public investment. However, once rates become too high, they become a significant drag on the economy, not only by limiting government expenditures when they are needed for defense and social programs but also by making it more challenging for the private sector to invest and hire, undermining the economy. The growing use of leverage in the financial system means that many investments are now highly sensitive to interest rate changes, suggesting the full compounding effect of higher interest rates may be even higher than presented here.

The modeling nicely visualizes the effect of the debt on the interest rate for 10-year US government bonds. The baseline scenario shows a gradual decline in this interest rate, reaching approximately 4.1% in 2036. Acting on the deficit as in the good-case scenario produces an even steeper decline in the interest rate to 3.6% by 2036. When compared to GDP, the debt under the good-case scenario is stabilized; economic theory predicts that financial markets would reward this positive fiscal outlook with lower interest rates.

Conversely, high deficits in the bad-case scenario lead to an increase in the interest rate to 4.6% in 2036. The different trajectories for the interest rate on 10-year US government bonds will also affect the cost for the Federal government to finance future deficits. Economic theory predicts that more debt will make deficits more expensive with associated higher interest rates.

Finally, the one-week government default scenario results in a significant spike in the interest rate for 10-year US government bonds to 6.9% in 2029, followed by volatility for the next several years before the long-term interest rate settles around 5.6%. This is nearly one percentage point higher than the long-term interest rate in the bad-case scenario, demonstrating the catastrophic consequences of a US default on the national debt. The extreme interest rate shock’s interest rates of between 8.2% and 8.5% translate to higher national debt of about 1% of GDP compared to the baseline, reflecting the higher costs the US government faces in the high-interest rate environment.

Case Studies

The analysis so far has presented macroeconomic indicators for deficits, the national debt, and interest rates. But how do these broad factors affect Americans in their daily lives? In other words, why should Americans care about the national debt—and demand that policymakers act? The rising national debt will affect us all in different ways, requiring a look at different generations in their respective life stages and situations to parse the specific consequences of our unsustainable fiscal outlook. To illustrate the effect of the national debt on a variety of situations, the following case studies examine a student planning for college, a family of four, a future retiree planning for retirement, and a small business.

Student

The first case study is a high school student planning to start undergraduate university studies in 2028. The student’s family will need to take out a $45,000 student loan to finance college. (The figure derives from adding an inflationary effect to the average student loan debt of $39,000 in 2025).10 The student also expects to attend a two-year graduate degree program in 2032, which would require another student loan of $30,000 at that time. The student will take out Federal student loans, which are tied to the 10-year Treasury yield with an additional fixed percentage of 2.05% for undergraduate loans and 3.6% for graduate loans.11 Under a standard 10-year repayment timeline, the student loan costs across the three scenarios are described below:

Table 1

Student loan costs

This case study demonstrates how the level of budget deficits affects student loan costs. Compared to the baseline scenario, reducing deficits under the good-case scenario leads to a 2.7% decrease in student loan payments (or a roughly $14,000 decrease). On the other hand, the bad-case scenario leads to a 3.2% increase in student loan payments compared to the baseline (or about a $16,000 increase). The one-week government default scenario causes an 8.7% (or about a $44,000) increase in student loan payments when compared to the baseline. The extreme interest rate shock has the most significant impact, increasing total student loan payments by nearly 61% (or about $310,000) over the baseline. As the deficit interacts with interest rates for government bonds, all types of loans will eventually be affected.

The differences in student loan costs are meaningful for younger Americans planning for college given the challenging environment for financing university studies. Young adults who go to college not only pay to attend but can also forgo income from employment to pursue their studies, setting them in the short-term behind their peers who enter the workforce immediately. Further, once a student graduates with an undergraduate and possibly also a graduate degree, the student enters the labor market facing a higher cost of living than today. Ideally, the benefit of education means that the student can command a higher salary in the labor market, but the student must also account for cost-of-living increases (and expected future salaries) in determining the amount of personal debt to assume in taking out a loan.

The student must also consider the overall environment for student loan debt. In the first quarter of 2026, Americans owed $1.87 trillion in Federal and private student loan debt, a 3.3% increase from the first quarter of 2025.12 After a period of low increases in total student loan debt between 2022 and 2024, the growth in total student loan debt accelerated in 2025.13 As of Q1 2026, more than 10.3% of student loans were 90 days or more delinquent, a significant increase from the level of 7.7% in Q1 2025.14 Over the past two decades, tuition costs have soared and recent graduates have struggled to find jobs after graduation during economic shocks like the 2008 financial crisis and the COVID-19 pandemic. Moreover, student loan debt is challenging to discharge via bankruptcy since borrowers must prove “undue hardship” from their loans in court, restricting flexibility to deal with financial emergencies.15 Thus, the projected differences in student loan costs could be the deciding factor in whether a student chooses to pursue going to college.

Family of four

The second case study involves a family of four with two parents, one young child, and one aging grandparent that requires caregiving. The family is saving for a down payment on a home to purchase sometime over the next decade to accommodate their family’s needs while also managing caregiving responsibilities for the child and grandparent.

As the figure below shows, budget deficits and the national debt have a significant effect on mortgage rates. Mortgage rates in the baseline scenario drop significantly over two years before settling at around 6%. For the good-case scenario, the lower overall interest rates lead to an even bigger decline in the mortgage rate to less than 5.8%. However, the higher deficits in the bad-case scenario cause mortgage rates to increase after 2028 before reaching 6.2% in 2036. The mortgage rates under the one-week government default scenario exhibit extreme volatility in the years after the default in 2029, before settling at 6.4% in 2036. The doubling of interest rates in the extreme interest rate shock scenario passes through the rest of the economy, influencing mortgage rates. In that scenario, mortgage rates sharply increase to 7.8% in 2026, before decreasing slightly and rising again to reach 7.7% in 2036.

Figure 5

Interest rate on a 30-year fixed rate mortgage (%)


Source: The Conference Board, 2026

With these dynamics in mind, the family is saving to buy a house in either five or 10 years and is targeting a home worth $600,000 with a standard 30-year fixed-rate mortgage and a 20% down payment to avoid paying even higher rates. The following table presents the total mortgage payments for each scenario based on buying a home in five years (in 2031) or 10 years (in 2036):

Table 2

Mortgage costs for a family of four

Disparities in mortgage interest rates begin to emerge in five years. Compared to the baseline scenario, total mortgage payments under the good-case scenario would be approximately $53,000, or 1.8% lower. For the bad-case scenario, total mortgage payments would be approximately $55,000, or 1.9% higher than under the baseline scenario. The one-week government default results in higher total mortgage payments of $133,000, or 4.6% compared to the baseline scenario. As with previous case studies, the extreme interest rate shock scenario leads to total mortgage payments being $760,000, or 26.3% higher than the baseline, which was the most negative impact on this family.

As deficits continue to accumulate and further affect interest rates in the broader economy, the deficits amplify the disparities across the three scenarios over the subsequent five years. If the family waits to buy a home until 2036, the total mortgage payments in the good-case scenario would be more than $105,000, or 3.7% lower than in the baseline scenario. In the bad-case scenario, total mortgage payments would be nearly $103,000, or 3.6% higher than under the baseline scenario. For the one-week government default scenario, total mortgage payments would increase by $194,000, or 6.7% over the baseline scenario. The extreme interest rate shock scenario causes the largest increase in total mortgage payments—$829,000, or 28.8% higher than the baseline. These are meaningful differences for prospective homeowners given the recent rise in the delinquency rate of mortgage loans. The delinquency rate of 4.44% in Q1 2026 was up 18 basis points from Q4 2025 and up 40 basis points from one year prior.16 This case study demonstrates how the deficit indirectly affects housing affordability and the benefit of a responsible fiscal policy to addressing cost-of-living concerns.

It is crucial to put housing costs in context for this family of four. The parents face childcare costs for their child and long-term care costs for the aging grandparent as they navigate how to finance the down payment on their home and their decision on when to buy. Regarding childcare, the average annual price of center-based childcare in 2025 was $15,570.17 US childcare costs are rising 1.5 times faster than overall inflation as of September 2025.18 These rising costs led 70% of respondents in a 2025 survey to say raising children is too expensive, up 13 points from 2024, with finances the number-one reason families limit the number of children they have.19 Some parents are forced to quit work or cut their work hours to become caregivers for their children, particularly women and those in lower-income households.20

The costs of long-term care services show similar trends, with price increases for most types of care outpacing inflation in 2024.21 The annual median cost of a home health aide or homemaker services in 2024 was between $75,000 and $78,000. Assisted living community costs increased by 10% in 2024 to an annual median cost of $70,800. Nursing home costs also increased by 7–9% in 2024, with the annual median cost of a semi-private room in a nursing home rising to $111,000 and a private room rising to $128,000. Given uncertainty regarding future funding of public health programs including Medicare and Medicaid related to the deficit and debt, these costs could change with a potentially higher share of responsibility shifting from government to families. Beyond this, given these high costs for providing childcare and long-term care for the other members of their household, the parents in this family of four would greatly benefit from any policies that make their mortgage more affordable.

Future retiree

The third case study involves an older American rapidly approaching retirement. The 67-year-old American will retire in 2026 and begin collecting their full Social Security benefit then. Unfortunately, this retiree who relies on their Social Security benefits confronts an uncertain future for the Social Security program. The CBO projects that the primary Trust Fund for Social Security retirement benefits will become insolvent in 2032, meaning that the reserves in the fund will be exhausted that year.22 Congress will be faced with a choice to either let Social Security benefits equal the revenue coming into the program or backfill Social Security with General Fund from the Treasury to keep benefits steady.

In the event that Congress chooses to let benefits equal payable amounts from the Trust Fund, individuals who obtain Social Security retirement benefits face a cut of 7% in 2032 and an average of 28% annually from 2033 to 2036, according to CBO’s latest projections. Assuming a monthly retirement benefit of $2,100 in 2026 (the average monthly retirement benefit for retired workers was $2,081 in April 202623), the retiree expects the original scheduled monthly retirement benefits below for 2032 through 2036. Assuming monthly benefits equal to payable amounts from the Trust Fund, the retiree faces a monthly benefit cut of $173 in 2032 and more than $700 in subsequent years.

Table 3

Monthly Social Security benefits as Trust Fund faces insolvency

If Congress decides to backfill the primary Social Security Trust Fund with money from the General Fund to preserve full scheduled benefits, the CBO estimates the funding needed to compensate for the anticipated reduction in Social Security retirement benefits post insolvency would amount to $2.7 trillion between 2032 and 2036. Backfilling some or all of this amount would directly increase the deficit absent additional revenue, leading to (or even accelerating) the precise dynamics present in the bad-case scenario with higher interest rates and costs for consumer loans.

Many older Americans face a challenging financial picture. The average retirement age is 62 in the US, an increase of five years since 1991.24 The expected retirement length also increased from 12.8 years to 18.6 years for men and from 16.6 to 21.3 years for women since 1970, putting pressure on workers to save even more for retirement. Social Security forms a core part of annual income for retirees, with 87% of eligible households obtaining Social Security benefits in 2023.25 Faced with impending reductions in Social Security benefits because of the Trust Fund’s projected insolvency, retirees must rely on other sources of income to compensate or cut spending. For those not yet in retirement, workers are making steady contributions to employer-sponsored retirement accounts and IRA accounts, whose balances experienced between 7% and 13% growth in 2024 tied to these contributions and market performance.26 Unfortunately, a record share of Americans are taking out hardship withdrawals from their retirement savings to cover emergency expenses, with (for example) 6% of individuals enrolled in Vanguard 401(k) plans making hardship withdrawals in 2025 compared to 5% in 2024.27

Health care costs for retirees are another important financial concern during retirement. Medicare also faces a projected insolvency in its Trust Fund within the next seven years, leading to reductions in government payments for Medicare health plans or a backfill from the General Fund to keep contributions steady. Total per capita out-of-pocket expenditure for health care has steadily grown over the past 50 years (even accounting for inflation), reaching $1,632 in 2024.28 While out-of-pocket costs for Medicare vary between Traditional Medicare and across Medicare Advantage plans, Medicare beneficiaries spent an average of $7,295 out-of-pocket in 2021.29 The medical expenses of Medicare beneficiaries also more than double between ages 70 and 90, putting pressure on retirement savings to cover out-of-pocket expenses in these later years.30 In a 2021 survey, 37% of Americans aged 65+ reported concerns with affording health care services, with 15% of respondents stating health care costs are a major financial burden for them.31 These concerns led 12% of Americans aged 65+ to avoid seeking treatment for a health problem and 24% to reduce spending on other needs including clothing, over-the-counter drugs, food, and utilities.32

Small business

The final case study is a small business looking to expand over the next decade. The owner has made a financial plan that requires two small business loans of $100,000 in five years and $150,000 in 10 years. The owner has a good relationship with their bank, and the bank is willing to offer an interest rate of the 10-year Treasury yield in the year the loan originated plus a 2% premium. As is common practice, each loan will be for 10 years to match the maturity of the government bond.33

The following table shows the total cost of the loans under each scenario:

Table 4

Total cost of small business loans

As with student loans and housing, the deficit’s effect on interest rates also impacts small businesses. Compared to the baseline scenario, the total loan payments under the good-case scenario are about $105,000, or 7% lower. Under the large deficits of the bad-case scenario, the total loan payments are about $107,000, or 7% higher than in the baseline scenario. The one-week government default scenario results in higher total loan payments of $329,000, or 21.6% compared to the baseline scenario. The doubling of interest rates in the extreme interest rate shock scenario produces the most impact, leading to higher total loan payments of $1,028,000, or 67.3% compared to the baseline. These are significant changes in the costs small businesses face to expand and invest under different fiscal outlooks. In addition, the small business owner could also have credit card debt (sensitive to movements in interest rates) or other types of credit arrangements for operational costs.

Small businesses are crucial for many local economies and comprise a significant percentage of employment. However, they currently face a highly uncertain economic and geopolitical environment, with changing tariff policies, rising energy prices tied to geopolitical conflicts, and labor supply shocks all combining to heighten uncertainty.34 Monthly surveys of small businesses in early 2026 showed that perceptions of uncertainty were well above their historical averages and optimism was below average.35 The data bear out these perceptions, with small business profitability falling 1.3% year-over-year in April 2026 because of slower sales tied to higher prices.36 Small business’ spending on gasoline grew by 31% year-over-year in April, demonstrating the significant pressure of energy costs on small businesses. Addressing the deficit would reduce the overall level of economic uncertainty and provide significant benefits for the economic engine of small business.

In response to rising delinquency rates during the COVID-19 pandemic, banks have tightened credit standards for small businesses, making it more difficult to take out a loan from a bank.37 As a result, small business owners may be forced to use credit cards to cover business expenses. In Q1 2026, American households held $1.25 trillion in credit card debt, a $70 billion increase from the previous year.38 While credit card loan delinquency rates have flattened since 2024, the current delinquency rate of 3% remains above pre-pandemic levels, suggesting households are struggling to manage previously accumulated credit card debt.39

How Policymakers Can Act to Address the Debt

The economic modeling—and the extrapolations of it to include real-world effects—demonstrate the urgency for policymakers to act to address our unsustainable fiscal outlook. The biggest drivers of the national debt are spending on Social Security benefits, major Federal health care programs, and net interest on the debt. The entire Federal budget, including mandatory spending and revenue, must be assessed through a comprehensive review, which a bipartisan fiscal commission can facilitate. The CEO Center has released a host of recommendations to improve the financial sustainability of Social Security, major Federal health programs, and other significant areas of the budget. When combined with budget process reforms, Congress and the President have ample options and opportunities to reset the trajectory of the national debt and counteract its negative effects.

Bipartisan fiscal commission in Congress

A bipartisan fiscal commission offers a structured, credible forum for lawmakers to put everything on the table and produce a package of reforms capable of stabilizing the nation’s finances before gradual erosion becomes genuine crisis.40 Establishing a bipartisan fiscal commission in Congress to address the debt crisis would not solve the problem overnight but it could break partisan logjams, focus both political parties on finding a solution, bring bipartisan credibility to reforms, and encourage public awareness and support.

The commission’s three primary strategic objectives should be to improve the long-term fiscal condition of the Federal government, hold the expected debt-to-GDP ratio to a more sustainable level (such as 100%), and address the long-term solvency of the Social Security and Medicare Trust Funds. For a commission to be successful, everything must be on the table. The commission should undertake a top-to-bottom review of all Federal spending and revenue sources. To avoid losing political momentum, the law establishing the commission should include strict timelines and commitments for votes on the House and Senate floor.

Following enactment, Congress should adopt strong enforcement mechanisms for future fiscal decisions to avoid altering the new fiscal trajectory. The American people must also understand the stakes. A public education campaign should explain the fiscal crisis, invite broad input, and build the political will needed for Congress to act. This effort should focus especially on groups most vulnerable to a debt crisis—younger generations, lower-income communities, and the “sandwich” generation.

Social Security

Regarding Social Security, lawmakers must address the short-term projected insolvency of the primary Trust Fund while also setting up the program for long-term solvency that better matches annual income and benefit payments.41 Since few reform options can fully address Social Security’s projected shortfall, Congress should consider a comprehensive package of reforms, which the bipartisan fiscal commission can facilitate.

Potential benefit adjustments to consider include gradually raising the full retirement age to 69, implementing modest additional means testing for high-income beneficiaries, using alternative annual cost-of-living adjustments to index Social Security benefits, and removing work disincentives for retirees. On the revenue side, Congress should consider gradually raising the maximum earned income subject to the payroll tax to cover 90% of earned wages or eliminating it entirely.

Congress may also explore the pros and cons of diversifying Trust Fund investments beyond Treasury securities to boost income on reserves (and considering the impact of this change on the market for Treasury securities), reinvesting dividends and interest over a long-term period. It’s important to protect vulnerable populations of retirees by increasing the minimum benefit to protect low-wage workers and those with intermittent careers and by adjusting the schedule of reforms to provide Americans approaching retirement age adequate time to adjust their retirement planning.

Major federal health programs

For the major Federal health programs of Medicare, Medicaid, and subsidies for health plans purchased through the Affordable Care Act, Congress has multiple opportunities to modernize these programs to promote fiscal sustainability and quality.42 Lawmakers should work collaboratively with the Centers for Medicare and Medicare Services (CMS) and health care providers to achieve the broad transformations needed to set Medicare and other Federal health programs on a more sustainable fiscal path.

Congress should consider a comprehensive package of reforms to address the impending financial insolvency of Medicare’s Trust Fund, which may include adjustments to premiums, cost sharing, and prescription drug payments. CMS should continue its implementation of value-based care and alternative payment models, including greater use of accountable care organizations. Congress, CMS, and health care providers should make upfront investments in workforce and data infrastructure to implement value-based care and alternative payment models effectively and efficiently.

Congress should evaluate and reform the payment methodology for Medicare Advantage plans to affirm that the plans are generating savings for the Medicare program and delivering value and high-quality care to enrollees in Medicare Advantage. Congress, CMS, and health care providers should also emphasize primary care and care coordination to improve health outcomes and achieve savings in the long term. The Administration and Congress should assess strategies to streamline regulations and payment policies that add costs and administrative burdens to the health care system.

Budget process reforms

While the bipartisan fiscal commission can provide a venue to reset the nation’s fiscal trajectory, Congress should also implement budget process reforms to restore a predictable and fair process, and prevent the late and incomplete budgets that have characterized recent decades.43 These reforms should ideally be part of a comprehensive reform package. Congress may consider these options either through reforms to rules via legislation or through the bipartisan fiscal commission.

The first set of reforms improves timeliness. One option is to require lawmakers to pass a budget on time by prohibiting legislation with any fiscal effect from being considered until a budget is passed. Congressional leadership may prevent Members of Congress from leaving for scheduled recesses to enforce this requirement (with exceptions for genuine emergencies). Congress may also consider moving from an annual budget process to a biennial one (respecting the rule that one Congress cannot bind a future Congress), which can include a two-year budget resolution, two-year appropriations, and/or multiyear authorizations of programs.

The second set of reforms mitigate dysfunction and challenges to regular order. Congress should strengthen budget enforcement mechanisms, including enforcing pay-as-you-go statutes, capping increases in discretionary spending, and utilizing sequestration as a last resort. Congress should also consider reforms to the debt limit, including automatic increases if fiscal targets in the budget resolution are met or requiring a debt limit increase or suspension vote with any legislation with a significant fiscal effect. Congress may also consider automatic continuing resolutions at the start of a fiscal year if it has failed to pass the budget on time.

Finally, Congress should also incorporate longer-term planning into the process. One path is to extend the time horizon for CBO baseline budget projections from 10 years to 25 years and require the CBO to assess the long-term impact of budget proposals and include interest costs in all scoring. Congress may also require statutory medium- and long-term targets for regular appropriations and for the national debt as a share of GDP, with the goal of reducing the national debt to a more sustainable 70% of GDP.

A better-functioning appropriations process will allow Congress and the President to consider reforms to other significant areas of the budget, such as Medicaid,44 the Department of Agriculture,45 and the Department of Veterans Affairs.46 By comprehensively assessing the budget, Congress and the President have an opportunity to reset our negative fiscal trajectory and put the country’s finances on a sustainable path forward.

Conclusion

The national debt is a tangible issue that already affects us all, with higher deficits leading to higher interest rates and higher costs for student loans, mortgages, and business loans. Neglecting the problem will not make it better and worsening our deficits will only increase the negative impacts of the debt on the rest of the economy. As this analysis has shown, reducing our deficits to a more sustainable level stabilizes the national debt as a percentage of GDP and produces positive savings for students, families, retirees, and businesses. Addressing the national debt deserves to be a high priority for both voters and lawmakers, to benefit all Americans.

Endnotes


  1. David K. Young, America’s $38 Trillion Debt Crisis Is Already Here. The Reckoning Comes Next, Fortune, March 17, 2026.
  2. Yelena Shulyatyeva, Global Economic Outlook 2026: US Edition: Transformation Amid Slower Growth, The Conference Board, December 8, 2025.
  3. Sylvester C.W. Eijffinger and Bilge Karatas, Three Sisters: The Interlinkage Between Sovereign Debt, Currency, and Banking Crises, Journal of International Money and Finance, Volume 131, March 2023.
  4. Congressional Budget Office, Introduction to CBO, June 2026.
  5. Congressional Budget Office, The Budget and Economic Outlook: 2026 to 2036, February 11, 2026.
  6. Board of Governors of the Federal Reserve System and FRED, Market Yield on U.S. Treasury Securities at 10-Year Constant Maturity, Quoted on an Investment Basis (DGS10), August 3, 2026.
  7. Congressional Budget Office, 10-Year Budget Projections, April 2018.
  8. White House Office of Management and Budget, Analytical Perspectives: 4, Federal Borrowing and Debt, February 12, 2018.
  9. Congressional Budget Office, Historical Budget Data, February 2026.
  10. Melanie Hanson, Average Student Loan Debt, Education Data Initiative, August 15, 2025.
  11. Ben Luthi, How the Federal Reserve's Rate Decision Impacts Student Loan Interest Rates, Yahoo! Finance, May 21, 2026.
  12. Matt Schulz, Student Loan Debt Statistics, LendingTree, June 2026.
  13. Hanson, Student Loan Debt Statistics.
  14. Matt Schulz, Student Loan Debt Statistics, LendingTree, June 2026.
  15. Council on Foreign Relations, Is Rising Student Debt Harming the US Economy?, April 16, 2024.
  16. Mortgage Bankers Association, Mortgage Delinquencies Increase in the First Quarter of 2026, May 14, 2026.
  17. First Five Years Fund, NEW: “High Cost of Childcare Shapes Families’ Choices and Futures”, November 18, 2025.
  18. Bank of American Institute, The Many Costs of Childcare, October 28, 2025.
  19. First Five Years Fund, NEW: “High Cost of Childcare Shapes Families’ Choices and Futures.”
  20. Bank of American Institute, The Many Costs of Childcare.
  21. Genworth, Genworth and CareScout Release Cost of Care Survey Results for 2024, March 4, 2025.
  22. Molly Dahl, Testimony on Social Security's Finances, Congressional Budget Office, March 25, 2026.
  23. Social Security Administration, Monthly Statistical Snapshot, April 2026, May 2026.
  24. Guardian, The Average Retirement Age in the US, July 17, 2025.
  25. Jennifer Clendening and Jun Ho Phue, More US Residents Are Working Past Retirement Age, Pew, August 4, 2025.
  26. Spencer Feingold, Americans' Retirement Accounts—and Hardship Withdrawals—Hit New Highs. Here's What to Know, World Economic Forum, March 11, 2026.
  27. Megan Cerullo, A Record Share of Americans Are Taking Emergency Withdrawals from Their 401(k)s, CBS News, March 5, 2026.
  28. Shameek Rakshit, et al., How Has US Spending on Health Care Changed Over Time?, Peterson-KFF Health System Tracker, January 22, 2026.
  29. AARP, Traditional Medicare Beneficiary Out-of-Pocket Costs, June 2026.
  30. Mariacristina De Nardi, et al., Medical Spending of the US Elderly, NIH National Library of Medicine National Center for Biotechnology Information, accessed June 5, 2026.
  31. Nicole Willcoxon, Older Adults Sacrificing Basic Needs Due to Health Care Costs, Gallup, June 15, 2022.
  32. Willcoxon, Older Adults Sacrificing Basic Needs Due to Health Care Costs.
  33. Caleb Quakenbush and Julia Pelletier, Why the National Debt Matters for the US Bond Market and the Economy, Bipartisan Policy Center, April 16, 2025.
  34. John Schroyer, As Corporate Profits Surge, America’s Small Businesses Get Left Behind, Forbes, June 2, 2026.
  35. National Federation of Independent Business, Small Business Optimism Index (April 2026), accessed June 5, 2026.
  36. Bank of America Institute, Small Business Checkpoint: A Roadmap Across the Country, May 19, 2026.
  37. Board of Governors of the Federal Reserve System, Financial Stability Report - November 2025: 2. Borrowing by Businesses and Households, November 25, 2025.
  38. Federal Reserve Bank of New York, Household Debt Balances Rise Slightly as Delinquency Transition Rates Hold Steady, May 12, 2026.
  39. Federal Reserve Bank of New York, Household Debt Balances Rise Slightly as Delinquency Transition Rates Hold Steady.
  40. The Committee for Economic Development, A Bipartisan Fiscal Commission to Tackle the National Debt, The Conference Board, February 17, 2026.
  41. The Committee for Economic Development, Saving Social Security, The Conference Board, February 12, 2024.
  42. The Committee for Economic Development, Modernizing Health Programs for Fiscal Sustainability and Quality, The Conference Board, November 18, 2024.
  43. The Committee for Economic Development, Reforming the Broken Federal Budget Process, The Conference Board, February 24, 2025.
  44. The Committee for Economic Development, Explainer: Medicaid, The Conference Board, August 25, 2025.
  45. The Committee for Economic Development, Explainer: Department of Agriculture Funding and Opportunities for Reform, The Conference Board, December 17, 2025.
  46. The Committee for Economic Development, Explainer: Veterans Programs and the Budget, The Conference Board, September 17, 2025.

Great News!

You already have an account with The Conference Board.

Please try to login in with your email or click here if you have forgotten your password.

Create An Account


By Clicking 'Create Account', You Agree To Our Terms Of Use

Create Account
  • Download
  • Download Report

More From This Series

Chart

How the Debt Impacts Americans

August 18, 2026

Chart

Solutions to the US Health Care Workforce Shortages

June 25, 2026

Report

Addressing US Health Care Workforce Shortages

June 25, 2026

Chart

Free and Fair Elections Are Fundamental to Democracy and a Stable Economy

May 19, 2026

Report

A Stable Democracy at 250: Trusted Elections as the Foundation

May 19, 2026

Chart

$38 Trillion in Debt: A Bipartisan Fiscal Commission to Tackle the National Debt

February 17, 2026

View Less View More

Conference Board Sample Web Chat
chatbot-Icon
TCB Logo
chatbot-Icon
C-Suite Insights - Sign up to receive weekly C-Suite Insights newsletters, updates, surveys, and other relevant email communications. Unsubscribe any time
WHO WE ARE
  • About Us
  • Our History
  • Our Experts
  • Our Leadership
  • In the News
  • Press Releases
  • Locations
EXPLORE
  • Membership
  • Centers
  • Councils
  • Reports
  • Events
 
  • Webcasts
  • Podcasts
  • Data
  • Ask TCB
  • This Week @ TCB
CONTACT US
  • North America
    +1 212 759 0900
    customer.service@tcb.org
  • EMEA
    +32 2 675 5405
    brussels@tcb.org
  • Asia
    Hong Kong | +852 2804 1000
    Singapore | +65 8298 3403
    service.ap@tcb.org
CAREERS
  • See Open Positions
Terms Of Use | Privacy Policy | Event Code of Conduct | Trademarks
© 2026 The Conference Board Inc. All rights reserved. The Conference Board and torch logo are registered trademarks of The Conference Board.
The use of all The Conference Board data and materials is subject to the Terms of Use. Reprint requests are reviewed individually and may be subject to additional fees.The Conference Board reserves the right to deny any request.
Terms of Use | Privacy Policy | Event Code of Conduct | Trademarks
© 2026 The Conference Board Inc. All rights reserved. The Conference Board and torch logo are registered trademarks of The Conference Board.
The use of all data from The Conference Board data and materials is subject to the Terms of Use. Reprint requests are reviewed individually and may be subject to additional fees.The Conference Board reserves the right to deny any request.

Thank you for signing up. You will now receive CEO Insights for What's Ahead every Wednesday morning. You can unsubscribe at any time or manage your preferences to receive more content from The Conference Board.

Important: Your Membership subscription payment is past due. We have not yet received your Membership payment. Please click the button below to pay your invoice.

Pay Invoice

Announcing The Conference Board AI Virtual Conference Series

Explore the Impact of AI on Your Business

Members receive complimentary registration - Learn more >>