-
LINKEDIN
-
EMAIL
-
TWITTER
-
FACEBOOK
Charting International Labor Comparisons - Consumer Prices
2014 Edition
21 Mar. 2014
Back to ILC Homepage
Chart 17.
Click legend to hide and show series. Hover over data series to show data for each country.
Chart 17: Average annual inflation rate, as measured by the Consumer Price Index and Harmonized Index of Consumer Prices (2007–2012)
Consumer price indexes (CPIs) and harmonized indexes of consumer prices (HICP) are two measures of consumer price changes. The HICP, however, are adjusted for comparability across countries, whereas the CPI are not adjusted.
From 2007 to 2012, inflation averaged between 1.5 and 2.5 percent in all but four of the countries compared in Chart 17. Prices increased at a faster rate in the United Kingdom and Belgium, while Japan was the only country where prices have declined since 2007. The two inflation rates were identical in six out of the 14 countries selected. Of the remaining eight, the difference between the two rates was greater than 0.1 percent in four countries, with the greatest differences occurring in the United States and Sweden. For most countries, the differing trends reflect differences in the way owner-occupied housing is treated by the CPI and the HICP.
Chart 18.
Click legend to hide and show series. Hover over data series to show data for each country.
Chart 18: HICP-based annual inflation rate (1997–2012)
Harmonized indexes of consumer prices (HICP) are an internationally comparable measure of consumer price inflation. Prior to the global recession, HICP-based inflation in most of the economies compared in Chart 18 peaked in 2008, as 12 of 16 economies reached inflation of 3 percent or higher that year. During the recession, price growth slowed in all countries and moved into deflationary territory in Spain, the United States, Japan, and Switzerland. By 2012, however, inflation recovered to over 2 percent in a majority of countries compared.
Other than the dip during the recession, annual inflation in the Euro Area has remained above 2 percent since 2000, highlighting how recent deflationary risk in the area has acted contrary to the historical trend.
Chart 19.
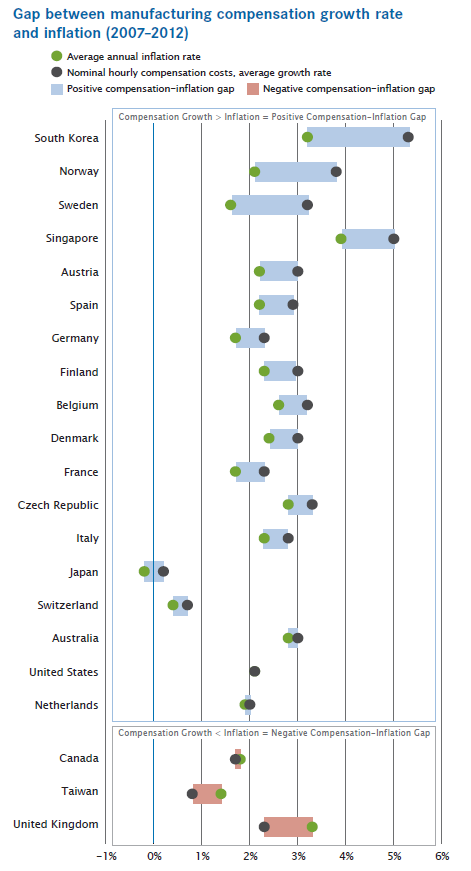
Note: Hourly compensation growth rates are based on national currency-denominated costs. Inflation as measured by each country’s consumer price index (CPI). National CPIs are not adjusted for comparability.
Source: The Conference Board, International Labor Comparisons program
Previous Section: Competitivenes in Manufacturing
First Section: About this Report
Chart 19: Gap between manufacturing compensation growth rate and inflation (2007–2012)
The gap between the growth rates of nominal compensation costs and consumer price indexes (CPIs) indicates the degree to which manufacturing worker compensation has kept up with inflation. Between 2007 and 2012, nominal compensation growth, on average, outpaced inflation in almost all of the economies shown in Chart 19. The compensation-inflation gap was largest in South Korea, Norway, and Sweden. As a result, these countries experienced the largest growth in real manufacturing compensation of the countries compared. Nominal compensation growth rates lagged inflation in only three countries: Canada, Taiwan, and the United Kingdom.
The use of all TCB data and materials is subject to the Terms of Use. Reprint requests are reviewed individually and may be subject to additional fees. TCB reserves the right to deny any request.