Our Privacy Policy has been updated! The Conference Board uses cookies to improve our website, enhance your experience, and deliver relevant messages and offers about our products. Detailed information on the use of cookies on this site is provided in our cookie policy. For more information on how The Conference Board collects and uses personal data, please visit our privacy policy. By continuing to use this Site or by clicking "OK", you acknowledge our privacy policy and consent to the use of cookies.  Our Privacy Policy has been updated! Detailed information on the use of cookies on this site is provided in our cookie policy and our privacy policy. 
TCB Tourch
Loading...
  • logoImage
  •  
    • US
    • EUROPE
    • ASIA
  • 2

    Close
    • Insights
        • Insights
        • Explore by Center
          • Explore by Center
          • CED
            Committee for Economic Development

          • Economy, Strategy & Finance

          • Governance & Sustainability

          • Human Capital

          • Marketing & Communications

        • Explore by Content Type
          • Explore by Content Type
          • Reports

          • Upcoming Webcasts

          • On Demand Webcasts

          • Podcasts

          • Charts & Infographics

        • Trending Topics
          • Trending Topics
          • Artificial Intelligence (AI)

          • Navigating Washington

          • Geopolitics

          • US Economic Forecast

          • Sustainability

          • Future of Work

    • Events
        • Events
        • Upcoming Events
          • Upcoming Events
          • People First: Opportunity and Access

          • CHRO Summit: Navigating through a Tsunami of Change

          • Future: People Asia

          • Executive Compensation in a Disruptive World

          • CED Distinguished Leadership Awards Celebration

          • The 2025 IBI/Conference Board Health and Productivity Forum

          • Explore all Upcoming Events

        • Member-Exclusive Programs
          • Member-Exclusive Programs
          • Center Briefings

          • Experts Live

          • Roundtables

          • Working Groups

          • Expert Briefings

    • Data
        • Data
        • Consumer Confidence Index

        • Data Central

        • TCB Benchmarking

        • Employment Trends Index

        • Global Economic Outlook

        • Leading Economic Indicators

        • Help Wanted OnLine

        • Labor Markets

        • Measure of CEO Confidence

        • Human Capital Benchmarking &
          Data Analytics

        • CMO+CCO Meter Dashboard

    • Centers
        • Centers
        • Our Centers
          • Our Centers
          • Committee for Economic Development

          • Economy, Strategy & Finance

          • Governance & Sustainability

          • Human Capital

          • Marketing & Communications

        • Center Membership
          • Center Membership
          • What Is a Center?

          • Benefits of Center Membership

          • Join a Center

    • Councils
        • Councils
        • Find a Council
          • Find a Council
          • Economy, Strategy & Finance

          • Governance & Sustainability

          • Human Capital

          • Marketing & Communications

        • Council Membership
          • Council Membership
          • What is a Council?

          • Benefits of Council Membership

          • Apply to a Council

    • Membership
        • Membership
        • Why Become a Member?
          • Why Become a Member?
          • Benefits of Membership

          • Check if Your Organization is a Member

          • Speak to a Membership Associate

        • Types of Membership
          • Types of Membership
          • Council

          • Committee for Economic Development

          • Economy, Strategy & Finance

          • Governance & Sustainability

          • Human Capital

          • Marketing & Communications

          • Insights

        • Already a Member?
          • Already a Member?
          • Sign In to myTCB®

          • Executive Communities

          • Member-Exclusive Programs

    • About Us
        • About Us
        • Who We Are
          • Who We Are
          • About Us

          • In the News

          • Press Releases

          • Our History

          • Support Our Work

          • Locations

          • Contact Us

        • Our Community
          • Our Community
          • Our Leadership

          • Our Experts

          • Trustees

          • Voting Members

          • Global Counsellors

          • Careers

          • This Week @ TCB

    • Careers
    • This Week @ TCB
    • Sign In to myTCB®
      • US
      • EUROPE
      • ASIA
    • Insights
      • Insights
      • Explore by Center
        • Explore by Center
        • CED
          Committee for Economic Development

        • Economy, Strategy & Finance

        • Governance & Sustainability

        • Human Capital

        • Marketing & Communications

      • Explore by Content Type
        • Explore by Content Type
        • Reports

        • Upcoming Webcasts

        • On Demand Webcasts

        • Podcasts

        • Charts & Infographics

      • Trending Topics
        • Trending Topics
        • Artificial Intelligence (AI)

        • Navigating Washington

        • Geopolitics

        • US Economic Forecast

        • Sustainability

        • Future of Work

    • Events
      • Events
      • Upcoming Events
        • Upcoming Events
        • People First: Opportunity and Access

        • CHRO Summit: Navigating through a Tsunami of Change

        • Future: People Asia

        • Executive Compensation in a Disruptive World

        • CED Distinguished Leadership Awards Celebration

        • The 2025 IBI/Conference Board Health and Productivity Forum

        • Explore all Upcoming Events

      • Member-Exclusive Programs
        • Member-Exclusive Programs
        • Center Briefings

        • Experts Live

        • Roundtables

        • Working Groups

        • Expert Briefings

    • Data
      • Data
      • Consumer Confidence Index

      • Data Central

      • TCB Benchmarking

      • Employment Trends Index

      • Global Economic Outlook

      • Leading Economic Indicators

      • Help Wanted OnLine

      • Labor Markets

      • Measure of CEO Confidence

      • Human Capital Benchmarking & Data Analytics

      • CMO+CCO Meter Dashboard

    • Centers
      • Centers
      • Our Centers
        • Our Centers
        • Committee for Economic Development

        • Economy, Strategy & Finance

        • Governance & Sustainability

        • Human Capital

        • Marketing & Communications

      • Center Membership
        • Center Membership
        • What is a Center?

        • Benefits of Center Membership

        • Join a Center

    • Councils
      • Councils
      • Find a Council
        • Find a Council
        • Economy, Strategy & Finance

        • Governance & Sustainability

        • Human Capital

        • Marketing & Communications

      • Council Membership
        • Council Membership
        • What is a Council?

        • Benefits of Council Membership

        • Apply to a Council

    • Membership
      • Membership
      • Why Become a Member?
        • Why Become a Member?
        • Benefits of Membership

        • Check if Your Organization is a Member

        • Speak to a Membership Associate

      • Types of Membership
        • Types of Membership
        • Council

        • Committee for Economic Development

        • Economy, Strategy & Finance

        • Governance & Sustainability

        • Human Capital

        • Marketing & Communications

        • Insights

      • Already a Member?
        • Already a Member?
        • Sign In to myTCB®

        • Executive Communities

        • Member-Exclusive Programs

    • About Us
      • About Us
      • Who We Are
        • Who We Are
        • About Us

        • In the News

        • Press Releases

        • This Week @ TCB

        • Our History

        • Support Our Work

        • Locations

        • Contact Us

      • Our Community
        • Our Community
        • Our Leadership

        • Our Experts

        • Trustees

        • Voting Members

        • Global Counsellors

        • Careers

        • This Week @ TCB

    • Careers
    • Sign In to myTCB®
    • Download TCB Insights App
  • Insights
    Insights

    Our research and analysis have helped the world's leading companies navigate challenges and seize opportunities for over 100 years.

    Explore All Research

    Economic Indicators

    • Explore by Center
    • CED
      Committee for Economic Development
    • Economy, Strategy & Finance
    • Governance & Sustainability
    • Human Capital
    • Marketing & Communications
    • Explore by Content Type
    • Reports
    • Upcoming Webcasts
    • On Demand Webcasts
    • Podcasts
    • Charts & Infographics
    • Trending Topics
    • Artificial Intelligence (AI)
    • Navigating Washington
    • Geopolitics
    • US Economic Forecast
    • Sustainability
    • Future of Work
  • Events
    Events

    Our in-person and virtual events offer unmatched opportunities for professional development, featuring top experts and practitioners.

    See Everything Happening This Week

    Sponsor a Program

    • Upcoming Events
    • People First: Opportunity and Access

      June 12 - 13, 2025

      CHRO Summit: Navigating through a Tsunami of Change

      June 24, 2025

      Future: People Asia

      September 04 - 05, 2025

    •  
    • Executive Compensation in a Disruptive World

      September 16 - 17, 2025

      CED Distinguished Leadership Awards Celebration

      October 08, 2025

      The 2025 IBI/Conference Board Health and Productivity Forum

      October 16 - 17, 2025

    • Member-Exclusive Programs
    • Center Briefings
    • Experts Live
    • Roundtables
    • Working Groups
    • Expert Briefings
    • Explore by Type
    • Events
    • Webcasts
    • Podcasts
    • Member-Exclusive Programs
    • Center Briefings
    • Experts Live
    • Roundtables
    • Working Groups
    • Expert Briefings
  • Data
    Corporate Disclosure Data

    TCB Benchmarking

    Real-time data & analytical tools to benchmark your governance, compensation, environmental, human capital management (HCM) and social practices against US public companies.

    Economic Data

    All Data

    See current direction and trends across key indicators

    Consumer Confidence Index

    US consumers' thoughts on the economy, jobs, finances and more

    Data Central

    One-stop, member-exclusive portal for the entire suite of indicators

    Labor Markets

    Covering all aspects of labor markets, from monthly development to long-term trends

    Measure of CEO Confidence

    Examines the health of the US economy from the perspective of CEOs


    Recession & Growth Trackers

    See the current and future state of 16 economies.

    Global Economic Outlook

    Track the latest short-, medium-, and long-term growth outlooks for 77 economies

    Leading Economic Indicators

    Track the state of the business cycle for 12 global economies across Asia and Europe

    Help Wanted OnLine

    Track the status of job markets across the US through online job listings

    Other Featured Data

    Human Capital Analytics Tools

    Tools to understand human capital management and corporate performance

    CMO+CCO Meter Dashboard

    Tracks the impact, resources, and satisfaction of CMOs and CCOs

  • Centers
    Centers

    Centers offer access to world-class experts, research, events, and senior executive communities.

    Our Centers
    • Committee for Economic Development
    • Economy, Strategy & Finance
    • Governance & Sustainability
    • Human Capital
    • Marketing & Communications
    Center Membership
    • What Is a Center?
    • Benefits of Center Membership
    • Join a Center
  • Councils
    Councils

    Councils are invitation-only, peer-led communities of senior executives that come together to exchange knowledge, accelerate career development, and advance their function.

    Find a Council
    • Economy, Strategy & Finance
    • Governance & Sustainability
    • Human Capital
    • Marketing & Communications
    Council Membership
    • What Is a Council?
    • Benefits of Council Membership
    • Apply to a Council
  • Membership
    Membership

    Membership in The Conference Board arms your team with an arsenal of knowledge, networks, and expertise that's unmatched in scope and depth.

    • Why Become a Member?
    • Benefits of Membership
    • Check if Your Organization is a Member
    • Speak to a Membership Associate
    • Types of Membership
    • Council
    • Committee for Economic Development
    • Economy, Strategy & Finance
    • Governance & Sustainability
    • Human Capital
    • Marketing & Communications
    • Insights
    • Already a Member?
    • Sign in to myTCB®
    • Executive Communities
    • Member-Exclusive Programs
  • About Us
    About Us

    The Conference Board is the global, nonprofit think tank and business membership organization that delivers Trusted Insights for What's Ahead®. For over 100 years, our cutting-edge research, data, events and executive networks have helped the world's leading companies understand the present and shape the future.

    Learn more about Membership

    • Who We Are
    • About Us
    • In the News
    • Press Releases
    • Our History
    • Support Our Work
    • Locations
    • Contact Us
    • Our Community
    • Our Leadership
    • Our Experts
    • Trustees
    • Voting Members
    • Careers
    • This Week @ TCB
Check if You're a Member
Create Account
Forgot Your Password?

Members of The Conference Board get exclusive access to the full range of products and services that deliver Trusted Insights for What's Ahead ® including webcasts, publications, data and analysis, plus discounts to conferences and events.

ESG Navigator ESG Navigator
  • Menu

  • Data

    • Economic Data & Analysis
    • Business Cycles
    • CEO Confidence
    • Consumer Confidence
    • Labor Markets
  • Analysis

    • U.S. Economic Forecast
    • Global Economic Outlook
Share
  • LINKEDIN
  • EMAIL
  • TWITTER
  • FACEBOOK
Share

Charting International Labor Comparisons - Competitiveness in Manufacturing


2014 Edition
21 Mar. 2014

Back to ILC Homepage

  • About
  • Gross Domestic Product
  • Labor Force
  • Competitiveness
  • Consumer Prices

Chart 8.

Click here for chart description.

Click legend to hide and show years.  Hover over data bars to show data for each year.

Chart 8: Hourly compensation costs in manufacturing, selected economies and regions, as a percentage of costs in the United States (2000–2012)

      The global marketplace often means that companies, especially in manufacturing, relocate certain operations from one country to another. While there are many criteria for making location decisions, labor cost differences across countries are a critical factor. Hourly compensation costs, or the average hourly cost (including benefits) to employ a worker, vary significantly across countries and regions in manufacturing.
      With the exception of a dip in compensation during the global recession, emerging economies in East Asia and Eastern Europe, as well as Brazil, have experienced rapid increases in manufacturing compensation costs relative to costs in the United States since the early-to-mid 2000s.
    Although there are several technical limitations with compensation estimates for China and India that diminish the meaningfulness of international comparisons, benchmarking compensation to the US level provides a less sensitive yardstick than costs expressed in US dollar terms. Between 2002 and 2009, manufacturing compensation costs in China grew the fastest of all countries compared in Chart 8 (16.4 percent annually, on average). However, at just 5.1 percent of US compensation costs in 2009, Chinese manufacturing compensation still remains far below labor costs in most other areas compared. By 2009, though, compensation costs in China relative to the US surpassed compensation costs in the Philippines (5.0 percent) and India (3.6 percent).


Chart 9.

Click here for chart description.

Click legend to hide and show components.  Hover over data bars to show data for each country.

Chart 9: Hourly compensation costs in manufacturing, by component, US dollars (2012)

      Hourly compensation costs, which measure the average hourly cost to employ a worker, include the following components: pay for time actually worked, including base wages and overtime; directly paid benefits, including leave pay and seasonal bonuses; and social insurance expenditures incurred by employers, including health and retirement plans. Employers’ social contributions often provide delayed future income and benefits to employees and are therefore an indirect form of worker compensation.
    In 2012, among 34 countries compared in Chart 9, total hourly compensation costs in US manufacturing ranked approximately in the middle at $35.67. In addition to Australia and Canada, countries with higher hourly compensation costs were primarily in northern and western Europe. Countries with lower hourly compensation costs were primarily in southern and eastern Europe, Asia, and Latin America.


Chart 10.

Click here for chart description.

Click legend to hide and show components.  Hover over data bars to show data for each country.

Chart 10. Components of manufacturing hourly compensation costs, as a percentage of total compensation (2012)

      Another way to compare manufacturing compensation costs across countries is to view the components of compensation as a percentage of total costs. (See Chart 9 for data in US dollars.)
      Pay for time worked, including base wages and overtime, constitute 50 to 75 percent of total compensation in most countries compared. In 2012, the share of pay for time worked was less than 50 percent only in Belgium, where other forms of manufacturing worker compensation carry a larger weight.
      Directly paid benefits primarily comprise pay for leave time, irregular bonuses, and pay in kind. The percentage of compensation for directly paid benefits tends to be higher in many European countries (due in large part to leave pay) and Japan (where seasonal bonuses are a large portion of costs). In 2012, for example, direct benefits constituted at least a quarter of total compensation in Poland and Japan. Directly paid benefits are a relatively smaller portion of compensation costs (i.e., less than 10 percent in 2012) in the United States, Australia, and Canada.
      In countries with the highest ratio of social insurance costs (e.g., Sweden, Brazil, and Belgium), social insurance makes up approximately one-third of total compensation costs. In the United States, social insurance costs account for about 24 percent of total compensation, while in Asian countries, with the exception of the South Korea, social insurance is less than 20 percent.
    The total benefits portion of compensation costs can be seen by combining social insurance with directly paid benefits. Total benefits surpass 40 percent in 14 countries. In contrast, the ratio of benefit costs in the United States is about 33 percent.


Chart 11.

Click here for chart description.

Source: The Conference Board, International Labor Comparisons program

Chart 11: Hourly compensation costs in manufacturing industries, US dollars (2012)

      Hourly compensation costs, or the hourly cost to the manufacturer of employing labor, are one of the most important indicators of international cost competitiveness in manufacturing. Assessing compensation costs for submanufacturing industries, however, can be more instructive than assessing average compensation for the manufacturing sector as a whole, which often masks important differences in costs and competitiveness at the industry level.
    In Chart 11, a country flag represents the average compensation cost in manufacturing for that country, and each notch along a country line represents average costs in a particular submanufacturing industry. Within each country, industry compensation costs can vary greatly from average manufacturing compensation.
    The overall spread of compensation costs across industries can be compared across countries by looking at the relative — and not the absolute — distance of costs between the highest and the lowest compensated industries. In 2012, for example, the highest paid industry was more than double the lowest paid industry in 13 of the 23 countries compared in Chart 11. The greatest variation in compensation across industries occurred in Brazil and Mexico, as well as in countries in eastern Europe and Asia. In Brazil, for instance, compensation in coke and petroleum products manufacturing was more than eight times the labor costs in the apparel industry. In contrast, industry compensation costs were relatively more compressed in Australia, New Zealand, and countries in northern and western Europe.
    Historically, the highest and lowest compensated industries have tended to be similar across countries. In 2012, coke and petroleum products and pharmaceuticals were among the highly paid industries, while the lower paid industries included apparel and wood products manufacturing.


Chart 12.

Click here for chart description.

Click legend to hide and show countries.  Hover over data series to show data for each year.

Chart 12: Productivity (output per hour worked) in manufacturing (1995–2012)

      Manufacturing productivity, defined as output per hour worked, measures how effectively labor hours are converted into output. Increases in labor productivity indicate that a country’s workforce is becoming more efficient.
      Historically, while manufacturing productivity has increased in all countries over the long run, the rate of productivity growth has varied across countries. Among advanced European economies in Chart 12, Finland and Sweden exhibited the fastest average annual productivity growth (6 percent or higher) during the 1990s and 2000s (i.e., prior to the global recession). Manufacturing productivity growth in emerging economies in Asia has also been historically robust. In South Korea, for example, productivity increased at 10.5 percent per year between 1990 and 2000, on average. In eastern Europe, another emerging bloc, productivity in the Czech Republic grew at an average annual rate of 9.7 percent from 2000 to 2007. On the other hand, Australia and Norway have had the slowest long-run productivity growth (on average under 2 percent per year between 1979 and 2012) of the countries compared.
    Manufacturing productivity weakened due to the 2008–2009 global recession in all economies shown in Chart 12. However, the extent of the impact differed among countries. Following the crisis, manufacturing productivity declines were largest in Finland, Germany, and Sweden, while productivity growth merely slowed in South Korea, Taiwan, and Norway. During the period from 2007 to 2012, manufacturing productivity was weakest among the Euro Area economies.


Chart 13.

Click here for chart description.

Note: For Belgium and Taiwan, data relate to manufacturing employees (wage and salary earners). For all other countries, data relate to all employed persons (employees and self-employed workers) in manufacturing.
Source: The Conference Board, International Labor Comparisons program

Chart 13: Average annual percent change in manufacturing productivity, output, and hours worked (2000–2012)

      Increases in labor productivity, or output per hour worked, are approximately equal to the difference between the growth of output and the growth of hours worked; the larger the gap between output and hours, the greater the productivity growth.
    Despite the 2008–2009 global recession, productivity increased between 2000 and 2012 in all countries compared. The largest productivity gains were in the Czech Republic, Taiwan, and South Korea, and these gains were primarily the result of strong output growth (while hours stayed the same or dipped slightly). Productivity growth in Japan resulted from approximately equal portions of output growth and hours decline. Productivity also increased in Spain, Denmark, and the United Kingdom despite falling output because the number of hours worked fell even more. Moreover, productivity gains were driven by a reduction in hours worked in 12 of the 19 countries compared.


Chart 14.

Click here for chart description.

Note: For Belgium and Taiwan, data relate to manufacturing employees (wage and salary earners). For all other countries, data relate to all employed persons (employees and self-employed workers) in manufacturing.
Source: The Conference Board, International Labor Comparisons program

Chart 14: Annual percent change in manufacturing productivity, output, and hours worked (2012)

      In 2012, manufacturing productivity (output per hour worked) declined in 12 of the 19 countries compared in Chart 14. For a majority of countries that saw a decrease in productivity, such as Finland and France, the trend was driven by falling output despite a modest decline in hours worked. For Japan and the United Kingdom, however, the decline in output was exacerbated by an increase in hours worked, which led to even larger productivity losses.
    In contrast, productivity increases, such as those in the United States and Norway, were primarily the result of gains in output. The main exception was Spain, where the fall in hours far outpaced the decline in output, resulting in the largest productivity increase in 2012 of the countries compared.


Chart 15.

Click here for chart description.

Note: Charted values are natural logarithms of productivity and compensation indexes. For Belgium and Taiwan, data relate to manufacturing employees (wage and salary earners). For all other countries, data relate to all employed persons (employees and self-employed workers) in manufacturing.
Source: The Conference Board, International Labor Comparisons program

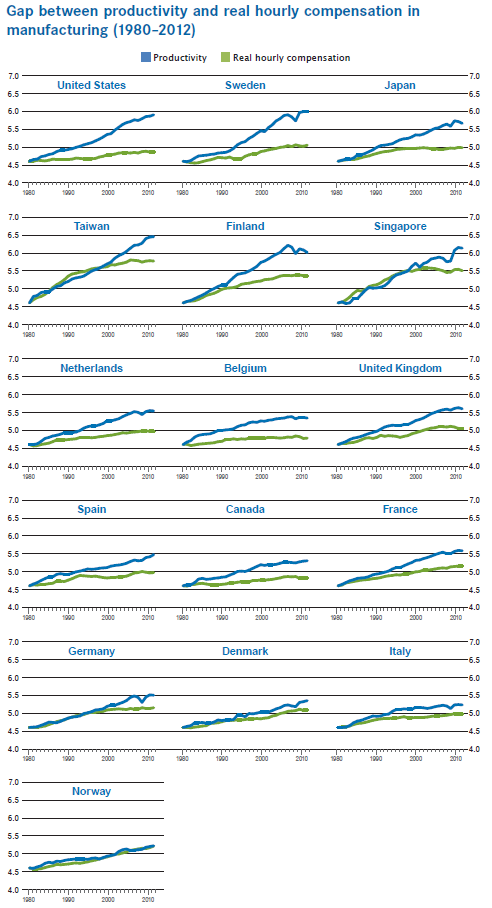
Chart 15: Gap between productivity and real hourly compensation in manufacturing (1980–2012)

      Since 1980, labor productivity has outpaced real hourly compensation in nearly all of the economies compared in Chart 15, creating a productivity compensation gap. Increases in productivity signal potential for increases in labor income and, by extension, increases in the standard of living of workers. To the extent that compensation growth does not track productivity growth, the fruits of productivity gains are not equally distributed among the factors of production.
    The size of the productivity-compensation gap varies by country, ranging from the largest in the United States to the smallest (nearly nonexistent) in Norway. The gap has also emerged at different times across the countries compared, starting in the 1970s in the United States and in the late 1990s in Singapore.


Chart 16.

Click here for chart description.

Click legend to hide and show series.  Hover over data series to show data for each country.

Previous Section: Labor Force

Next Section: Consumer Prices

Chart 16: Manufacturing unit labor costs, annual percent change (2012)

      Unit labor costs (ULCs), or total compensation divided by real output, are the direct link between productivity and the cost of labor required in generating output. In 2012, manufacturing ULCs in national currency terms increased in all countries compared in Chart 16, with the exceptions of Spain, Denmark, and the United States.
      When converted to a common currency, ULCs are used to compare cost competitiveness across countries. In US dollar terms, when ULCs in other countries rise faster (or decline slower) than ULCs in the United States, US cost competitiveness improves. As such, ULCs are a widely used measure in assessing firms’ location decisions.
    Despite almost across-the-board increases in ULCs in national currency units, when the same data are expressed in US dollars, the results are mixed. In 2012, due to the appreciation of the US dollar, ULCs in US dollar terms increased in nine of the 19 countries. Therefore, US manufacturing increased competitiveness against all countries where ULCs in US dollars rose, as well as in Norway. Notably, US competitiveness increased against all Asian countries (Taiwan, South Korea, Singapore, and Japan) and had the largest improvement against the United Kingdom. On the other hand, the US competitive position deteriorated against eight of the 19 countries. This decline was most notable in Spain and other Euro Area economies that saw greater declines in US dollar-based ULCs than the United States.


The use of all TCB data and materials is subject to the Terms of Use. Reprint requests are reviewed individually and may be subject to additional fees. TCB reserves the right to deny any request.

Charting International Labor Comparisons

Charting International Labor Comparisons, 2014

Full Report

Conference Board Sample Web Chat
chatbot-Icon TCB Logo
chatbot-Icon
Navigating Washington - Sign up to receive the latest business insights related to executive orders, new laws, and changing regulations.
ABOUT US
  • Who We Are
  • Annual Report
  • Our History
  • Our Experts
  • Our Leadership
  • In the News
  • Press Releases
MEMBERSHIP
  • Become a Member
  • Sign In to myTCB®
  • Access Experts
  • Member-Only Events
  • Data & Benchmarking
  • Manage Account
EXPLORE
  • Centers
  • Councils
  • Latest Research
  • Events
  • Webcasts
  • Podcasts
  • This Week @ TCB
CONTACT US
  • Americas
    +1 212 759 0900
    customer.service@tcb.org
  • Europe/Africa/Middle East
    +32 2 675 5405
    brussels@tcb.org
  • Asia
    Hong Kong | +852 2804 1000
    Singapore | +65 8298 3403
    service.ap@tcb.org
CAREERS
  • See Open Positions
Terms Of Use | Privacy Policy | Event Code of Conduct | Trademarks
© 2025 The Conference Board Inc. All rights reserved. The Conference Board and torch logo are registered trademarks of The Conference Board.
The use of all The Conference Board data and materials is subject to the Terms of Use. Reprint requests are reviewed individually and may be subject to additional fees.The Conference Board reserves the right to deny any request.
Terms of Use | Privacy Policy | Event Code of Conduct | Trademarks
© 2025 The Conference Board Inc. All rights reserved. The Conference Board and torch logo are registered trademarks of The Conference Board.
The use of all data from The Conference Board data and materials is subject to the Terms of Use. Reprint requests are reviewed individually and may be subject to additional fees.The Conference Board reserves the right to deny any request.

Thank you for signing up. You will now receive CEO Insights for What's Ahead every Wednesday morning. You can unsubscribe at any time or manage your preferences to receive more content from The Conference Board.

Announcing The Conference Board AI Virtual Conference Series

Explore the Impact of AI on Your Business

Members receive complimentary registration - Learn more >>