
Loading...


For Release 9:00 AM ET, October 27, 2025
Using the Composite Indexes: The Leading Economic Index (LEI) provides an early indication of significant turning points in the business cycle and where the economy is heading in the near term. The Coincident Economic Index (CEI) provides an indication of the current state of the economy. Additional details are below.
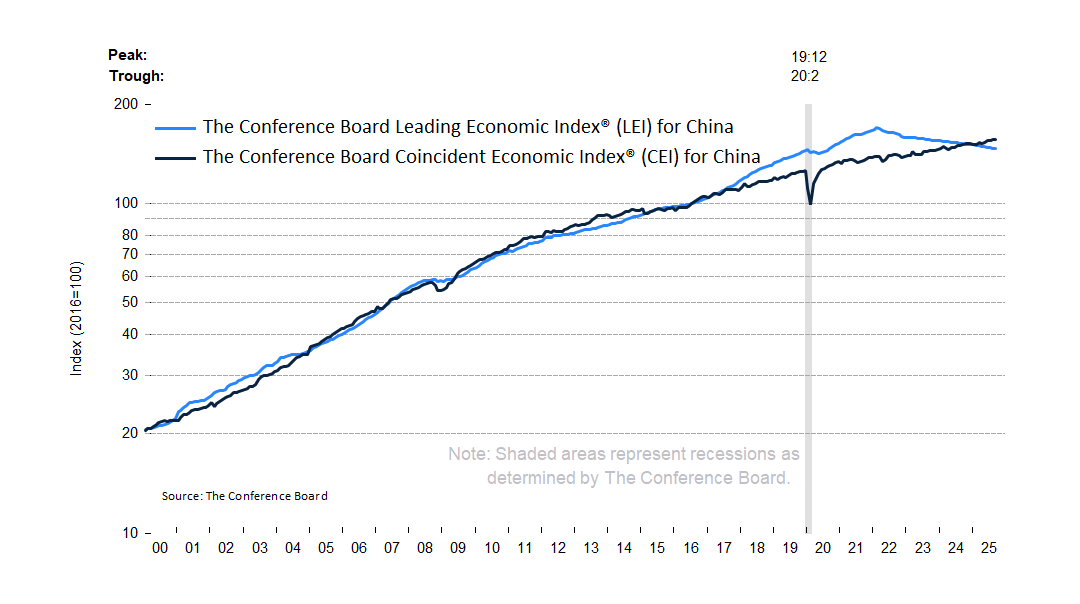
The Conference Board Leading Economic Index®(LEI) for China ticked down by 0.1% in September 2025 to 146.7 (2016=100), after contracting by 0.4% in August. As a result, the LEI declined by 2.0% over the six-month period from March to September 2025, continuing a 1.3% decline over the previous six-month period between September 2024 and March 2025.
The Conference Board Coincident Economic Index® (CEI) for China increased by 0.4% in September 2025 to 156.5 (2016=100), after expanding by 0.3% in August. Overall, the LEI grew by 2.6% over the six-month period from March to September 2025, close to twice the 1.4% growth observed over the previous six-month period between September 2024 and March 2025.
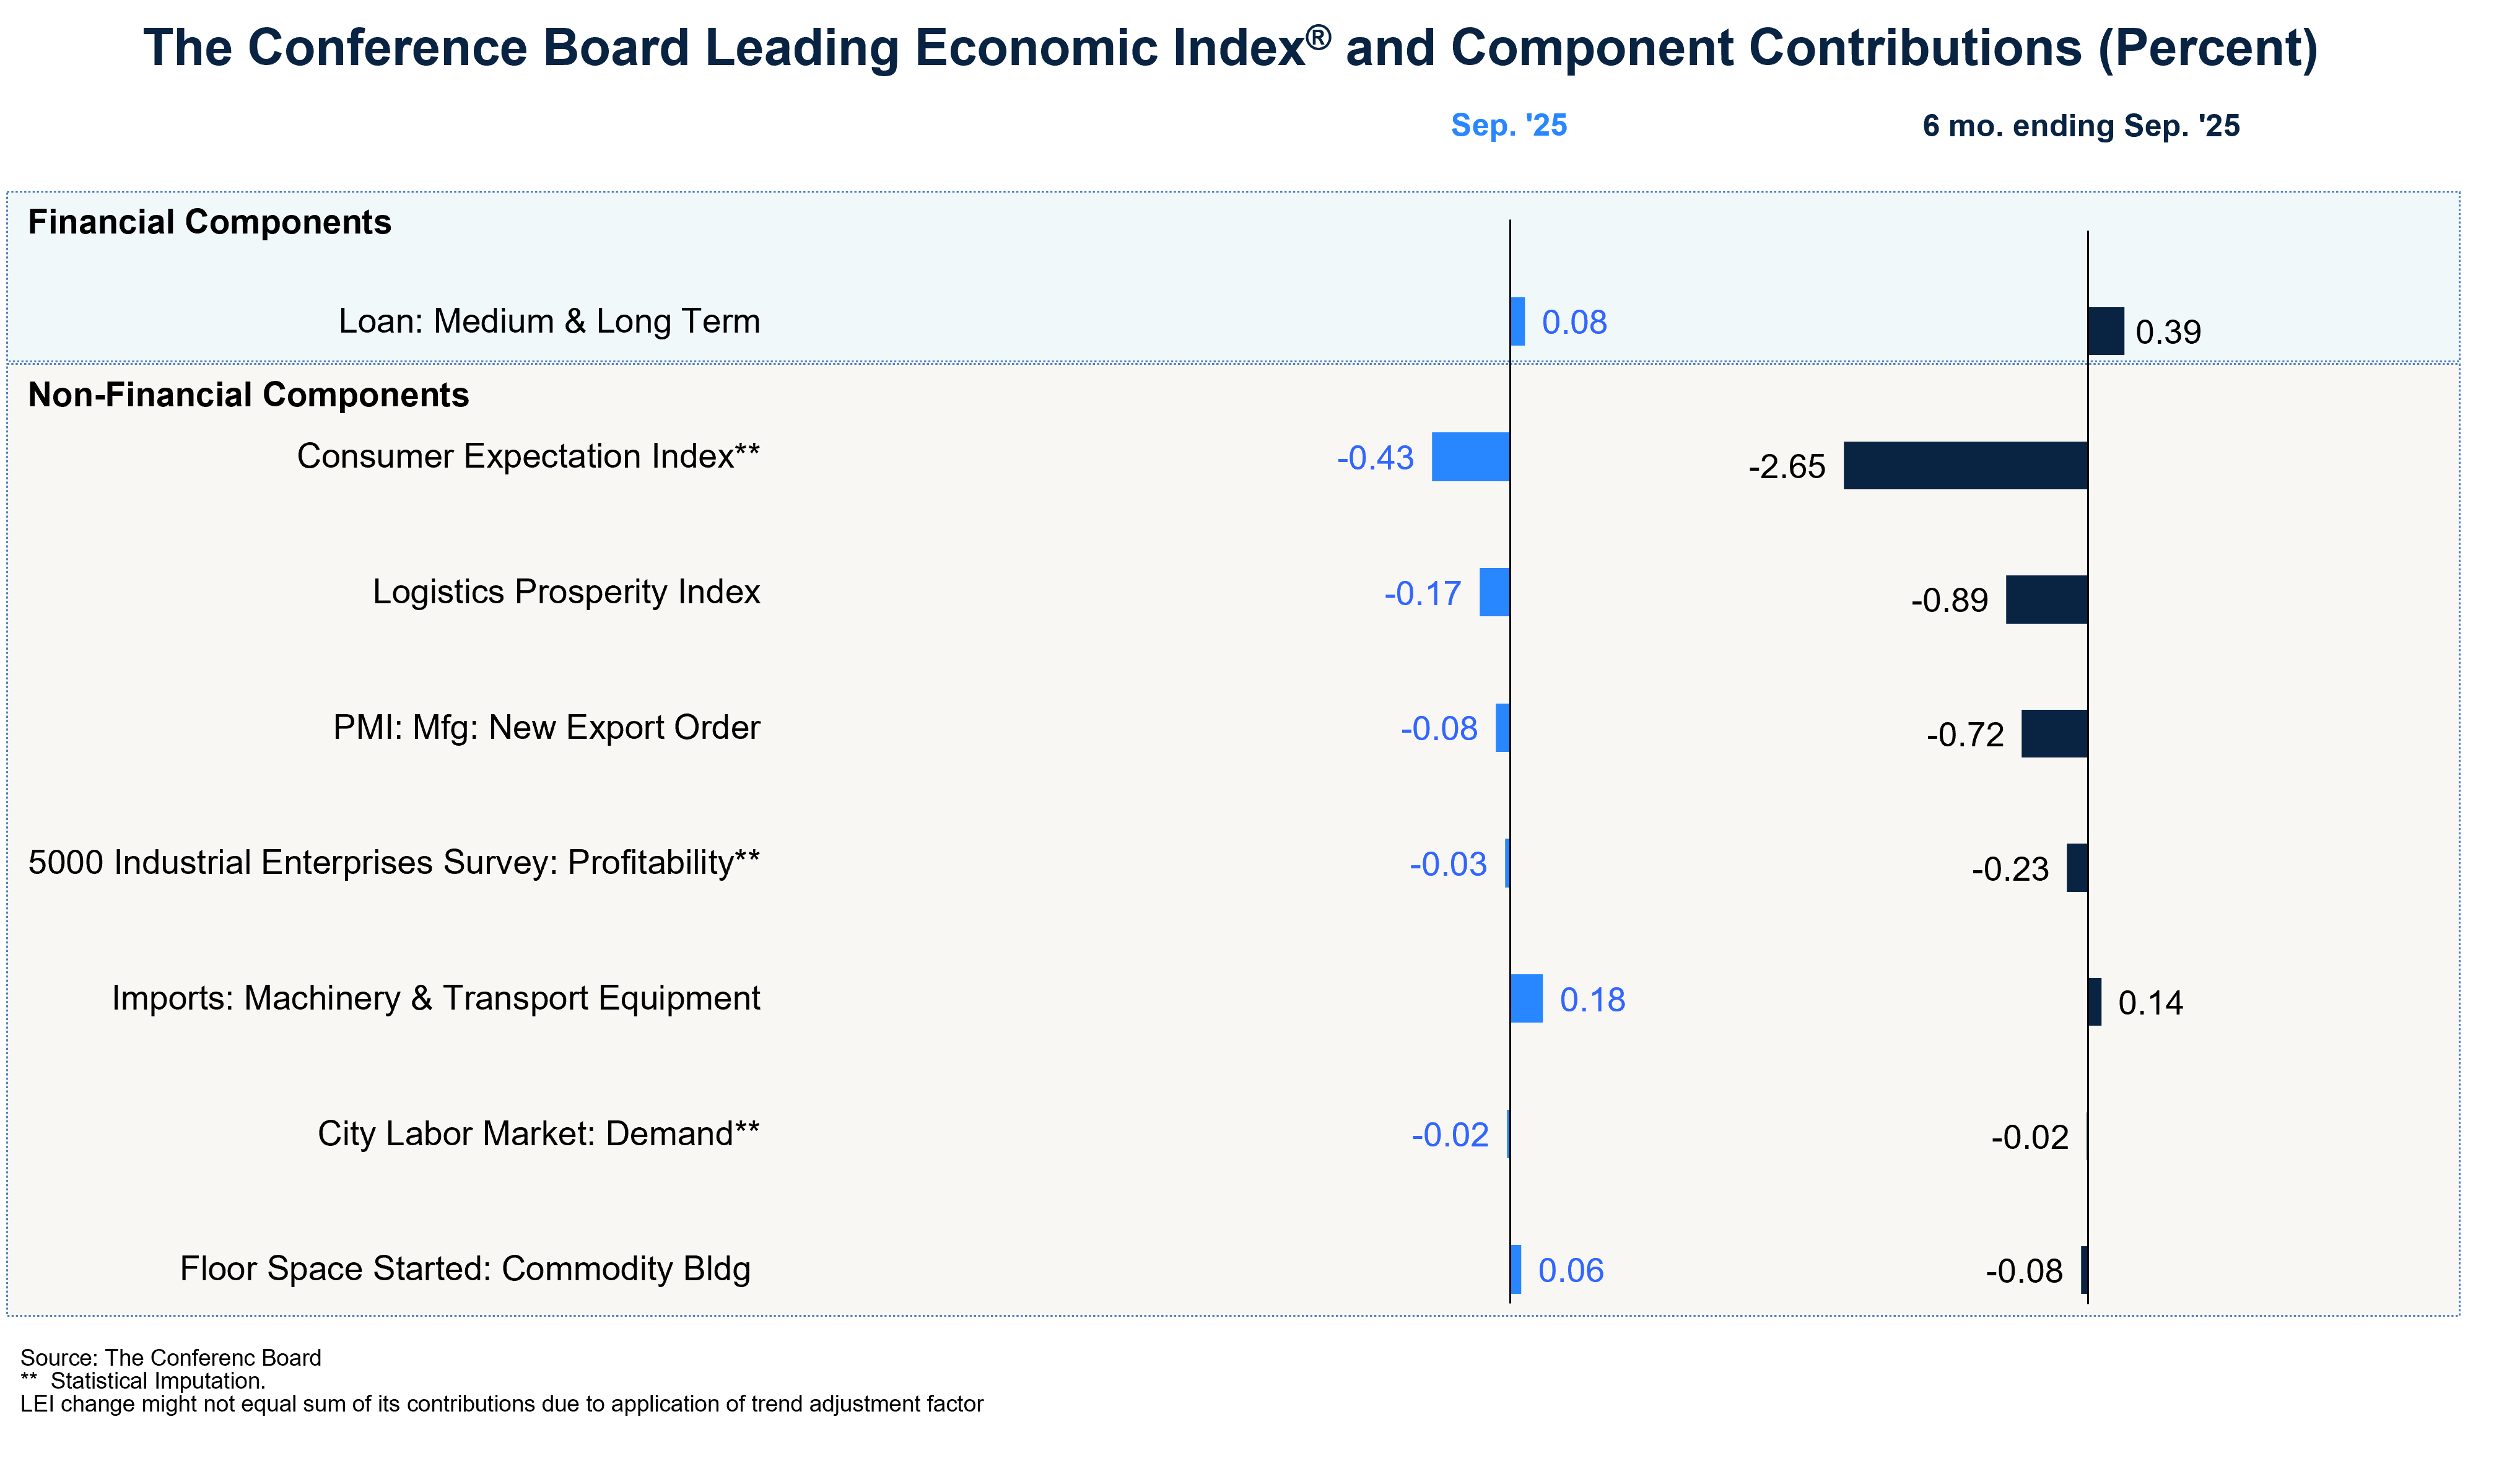
“The China LEI ticked down in September, marking the ninth month of consecutive decline in 2025,” said Timothy Brennan, Economic Research Associate, at The Conference Board. “Weakness was driven by a decline in 5 out of 8 components of the LEI. Consumer confidence continued to be the primary drag on the index, while the logistics prosperity index, and new orders in manufacturing also made significant negative contributions. On the other hand, growth in machinery and transportation equipment imports, medium- and long-term loans, and building construction supported the index, but not enough to offset broader weakness in other components. With the negative semi- and annual growth rates of the LEI pointing to headwinds and with the 6-month diffusion falling below 50, the recession signal went off again in September. Persistent deflation, driven by weak consumption and overcapacity in many industries, slowed China’s third-quarter GDP growth to 4.8% year-on-year, its lowest level in a year. As such, The Conference Board currently forecasts annual real GDP growth to be 4.7% in 2025 and 4.5% in 2026.”
The next release is scheduled for Monday, November 24, 2025, at 9:00 A.M. ET
The China LEI has been on a downward trend since the beginning of 2022
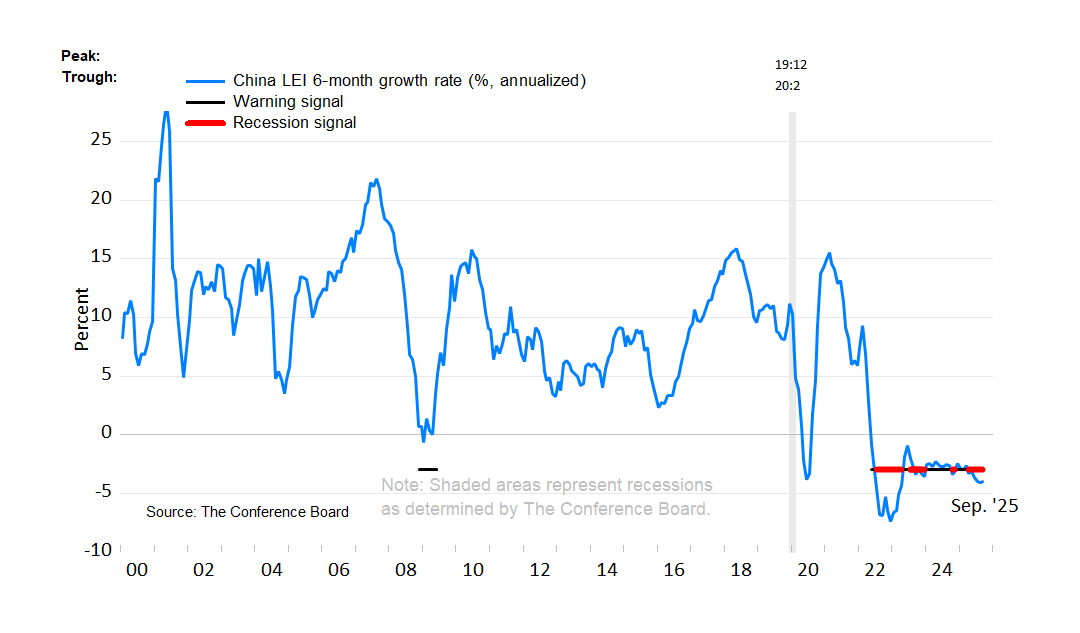
NOTE: The chart illustrates the so-called 3Ds—duration, depth, and diffusion—for interpreting a downward movement in the LEI. Duration refers to how long the decline has lasted. Depth denotes the size of decline. Duration and depth are measured by the rate of change of the index over the most recent six months at an annualized rate. Diffusion is a measure of how widespread the decline is among the LEI’s component indicators—on a scale of 0 to 100, a diffusion index reading below 50 indicates most components are weakening.
The 3Ds rule signals an impending recession when: 1) the six-month diffusion index lies at or below 50, shown by the black warning signal lines in the chart; and 2) the LEI’s six-month growth rate (annualized) falls below the threshold of −2.8%. The red recession signal lines indicate months when both criteria are met simultaneously—and thus that a recession is likely imminent or underway.
About The Conference Board Leading Economic Index® (LEI) and Coincident Economic Index® (CEI) for China
The composite economic indexes are key elements in an analytic system designed to signal peaks and troughs in the business cycle. Comprised of multiple independent indicators, the indexes are constructed to summarize and reveal common turning points in the economy in a clearer and more convincing manner than any individual component.
The CEI reflects current economic conditions and is highly correlated with real GDP. The LEI is a predictive tool that anticipates—or “leads”—turning points in the business cycle by around five months.
The eight components of the Leading Economic Index® for China are:
The four components of the Coincident Economic Index® for China are:
To access data, please visit: https://data-central.conference-board.org/
About The Conference Board
The Conference Board is the member-driven think tank that delivers Trusted Insights for What's Ahead®. Founded in 1916, we are a non-partisan, not-for-profit entity holding 501(c)(3) tax-exempt status in the United States. TCB.org
PRESS RELEASE
LEI for India Increased in September
October 23, 2025
PRESS RELEASE
LEI for Mexico Increased in September
October 21, 2025
PRESS RELEASE
The LEI for France Improved in August
October 17, 2025
PRESS RELEASE
LEI for the Euro Area Declined in September
October 16, 2025
PRESS RELEASE
LEI for Brazil Increased in September
October 15, 2025
PRESS RELEASE
The LEI for Germany Declined Again in August
October 14, 2025
All release times displayed are Eastern Time
Note: Due to the US federal government shutdown, all further releases for The Conference Board Employment Trends Index™ (ETI), The Conference Board-Lightcast Help Wanted OnLine® Index (HWOL Index), The Conference Board Leading Economic Index® of the US (US LEI) and The Conference Board Global Leading Economic Index® (Global LEI) data may be delayed. TCB will resume publication once updated US federal government data are released.

October 20, 2025 | Database
Business & Economics Portfolio
October 08, 2025 | Database
September 29, 2025 | Report
The Economy Stabilized in August but Outlook Remains Weak
September 27, 2023 | Report
China's Economic Recovery Continues to Stutter (Economy Watch: China View, June 2023)
June 30, 2023 | Report
Leading Economic Indicators and the Oncoming Recession
December 07, 2022 | Article

The Evolving Economic Outlook for Europe
July 10, 2024
Is a Global Recession on the Horizon?
July 13, 2022
