The Conference Board publishes leading, coincident, and lagging indexes designed to signal peaks and troughs in the business cycle for major economies around the world.
The Conference Board Leading Economic Index® (LEI) for the US Inched Up in April
Latest Press Release
Updated: Friday, May 22, 2026
Using the Composite Indexes: The Leading Economic Index (LEI) provides an early indication of significant turning points in the business cycle and where the economy is heading in the near term. The Coincident Economic Index (CEI) provides an indication of the current state of the economy. Additional details are below.
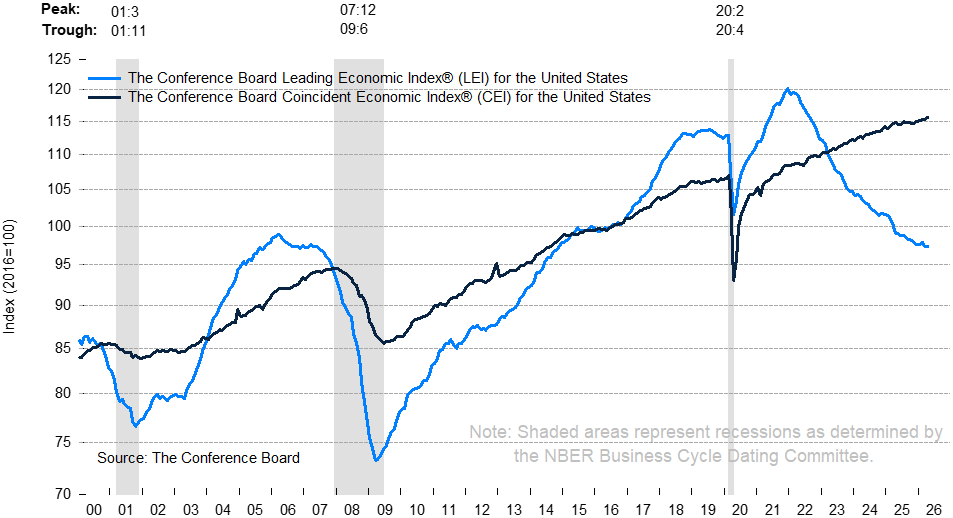
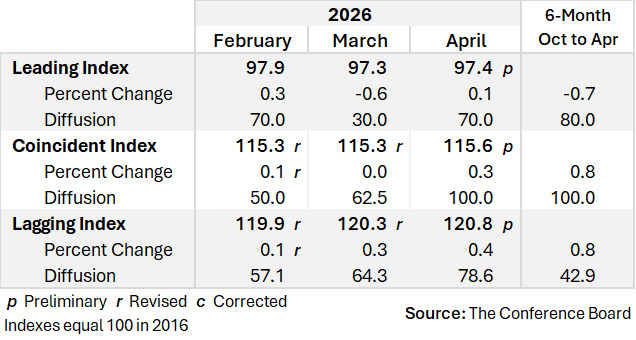
The Conference Board Leading Economic Index® (LEI) for the US rose slightly by 0.1% in April 2026 to 97.4 (2016=100), following a 0.6% decline in March. Overall, the LEI fell by 0.7% over the six months between October 2025 and April 2026, a less severe rate of decline than its 1.0% contraction over the previous six months (April to October 2025).
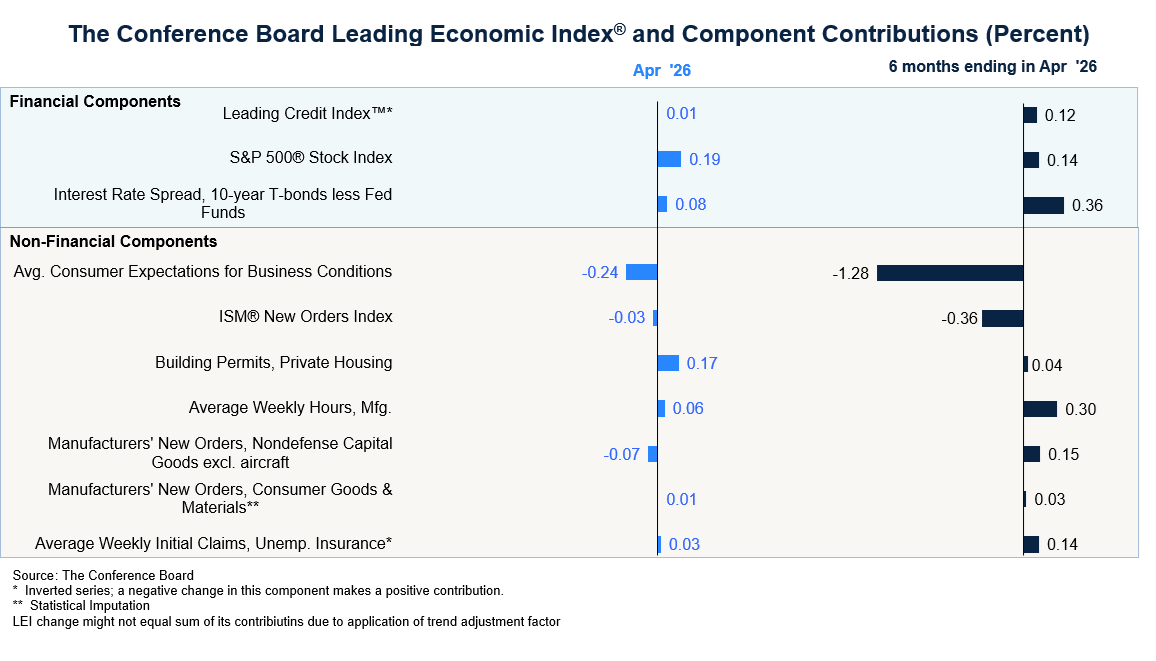
“The US LEI increased slightly in April, driven mainly by a rebound in stock prices and an increase in building permits, only for two and more units,” said Justyna Zabinska-La Monica, Senior Manager, Business Cycle Indicators, at The Conference Board. “The leading index rose in two of the past three months, but the gains did not offset the steep fall registered in March. As a result, the LEI’s six- and twelve-month growth rates were negative, signaling fragile economic conditions ahead. Strong investment in AI infrastructure, data centers, and energy production likely will have a positive impact on growth and sustain business spending, but may only partially offset weakness on the consumer side. Higher gasoline and energy costs—paired with weak hiring—will likely erode household purchasing power in the months ahead, particularly for lower- and middle-income consumers. The Conference Board is currently projecting 1.7% y/y GDP growth in 2026, revised up slightly from last update of 1.6%.”
The Conference Board Coincident Economic Index® (CEI) for the US increased by 0.3% in April to 115.6 (2016=100), after remaining unchanged in March. Overall, the CEI expanded by 0.8% over the six months between October 2025 and April 2026, a dramatic improvement from its decline of 0.1% over the previous six months. The CEI’s four component indicators—payroll employment, personal income less transfer payments, manufacturing and trade sales, and industrial production—are included among the data used to determine recessions in the US. All components of the CEI made positive contributions in April, led by industrial production.
The Conference Board Lagging Economic Index® (LAG) for the US rose by 0.4% to 120.8 (2016=100) in April 2026, after increasing by 0.3% in March. As a result, the LAG’s six-month change was positive, growing by 0.8% between October 2025 and April 2026, up from its 0.5% growth over the previous six months (April to October 2025).
Next month’s release of the composite economic indexes will incorporate annual benchmark revisions which bring them up to date with revisions in the source data. These revisions do not change the cyclical properties of the indexes. The indexes are updated throughout the year, but only for the previous six months. Data revisions that fall outside of the moving six-month window are not incorporated until the benchmark revision is made and the entire histories of the indexes are recomputed. As a result, the revised indexes, in levels and month-on-month changes, will not be directly comparable to those issued prior to the benchmark revision.
For more information, please visit conference-board.org/topics/business-cycle-indicators/ or contact us at indicators@tcb.org.
The US LEI inched up slightly in April
Rebounding stock prices and stronger building permits drove April’s gains, while consumer expectations continued to weigh heavily on the LEI
The LEI’s six-month trend remains negative, indicating a fragile economic outlook ahead—but a recession continues to be unlikely
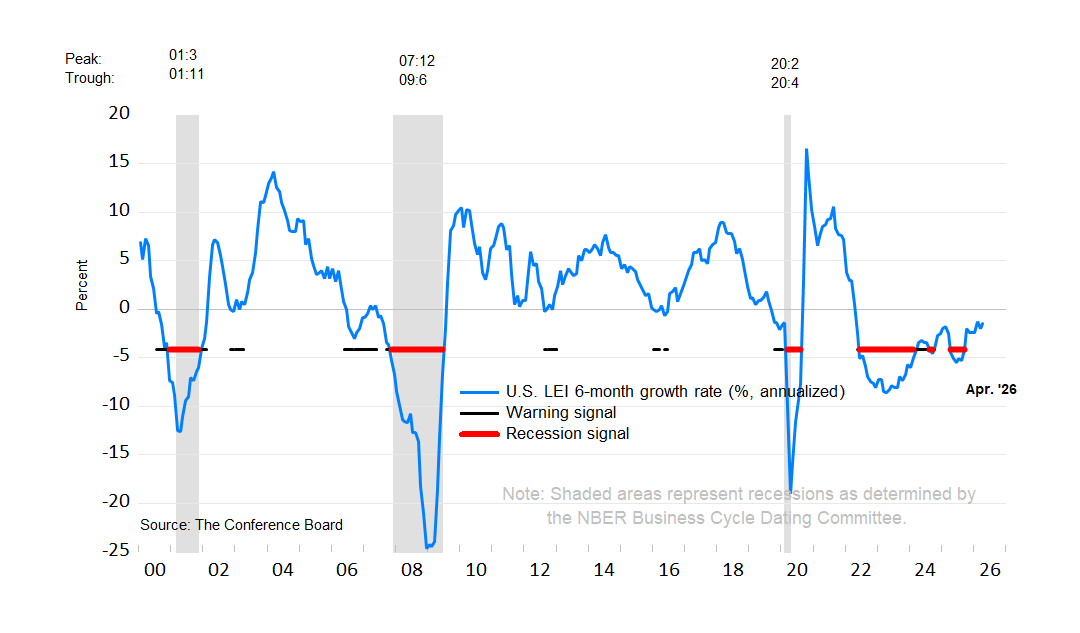
NOTE: The chart illustrates the so-called 3Ds—duration, depth, and diffusion—for interpreting a downward movement in the LEI. Duration refers to how long the decline has lasted. Depth denotes the size of decline. Duration and depth are measured by the rate of change of the index over the most recent six months at an annualized rate. Diffusion is a measure of how widespread the decline is among the LEI’s component indicators—on a scale of 0 to 100, a diffusion index reading below 50 indicates most components are weakening.
The 3Ds rule signals an impending recession when: 1) the six-month diffusion index lies at or below 50, shown by the black warning signal lines in the chart; and 2) the LEI’s six-month growth rate (annualized) falls below the threshold of −4.3%. The red recession signal lines indicate months when both criteria are met simultaneously—and thus that a recession is likely imminent or underway.
Summary Table of Composite Economic Indexes
About The Conference Board Leading Economic Index® (LEI) and Coincident Economic Index® (CEI) for the US
The composite economic indexes are key elements in an analytic system designed to signal peaks and troughs in the business cycle. Comprised of multiple independent indicators, the indexes are constructed to summarize and reveal common turning points in the economy in a clearer and more convincing manner than any individual component.
The CEI reflects current economic conditions and is highly correlated with real GDP. The LEI is a predictive tool that anticipates—or “leads”—turning points in the business cycle by around seven months.
The ten components of the Leading Economic Index® for the US are:
- Average weekly hours in manufacturing
- Average weekly initial claims for unemployment insurance
- Manufacturers’ new orders for consumer goods and materials
- ISM® Index of New Orders
- Manufacturers’ new orders for nondefense capital goods excluding aircraft orders
- Building permits for new private housing units
- S&P 500® Index of Stock Prices
- Leading Credit Index™
- Interest rate spread (10-year Treasury bonds less federal funds rate)
- Average consumer expectations for business conditions
The four components of the Coincident Economic Index® for the US are:
- Payroll employment
- Personal income less transfer payments
- Manufacturing and trade sales
- Industrial production
To access data, please visit: https://data-central.conference-board.org/
About The Conference Board
The Conference Board is the Member-driven think tank that delivers Trusted Insights for What's Ahead®®. Founded in 1916, we are a nonpartisan, not-for-profit organization holding 501 (c) (3) tax-exempt status in the United States. TCB.org | Learn about Membership