The Conference Board publishes leading, coincident, and lagging indexes designed to signal peaks and troughs in the business cycle for major economies around the world.
The Conference Board Leading Economic Index® (LEI) for the US Fell Slightly in July
Latest Press Release
Updated: Thursday, August 21, 2025
Using the Composite Indexes: The Leading Economic Index (LEI) provides an early indication of significant turning points in the business cycle and where the economy is heading in the near term. The Coincident Economic Index (CEI) provides an indication of the current state of the economy. Additional details are below.
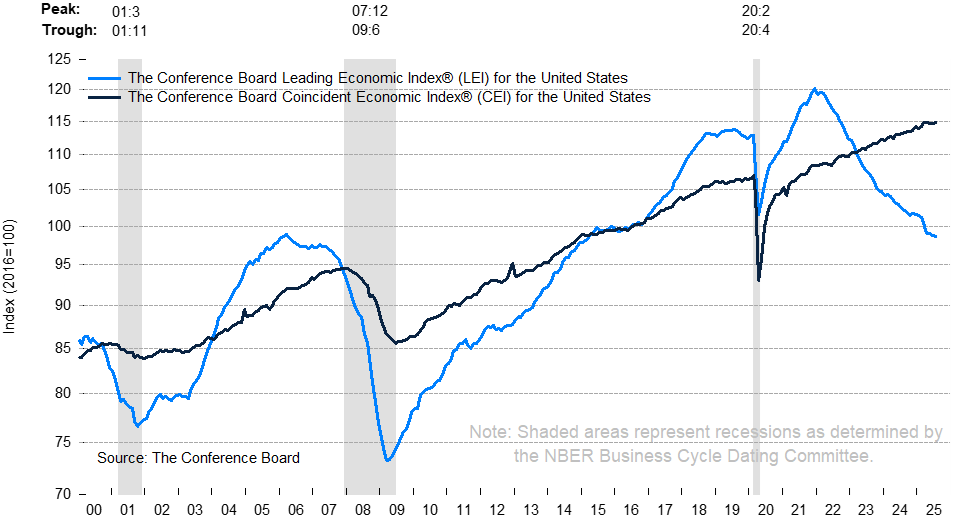
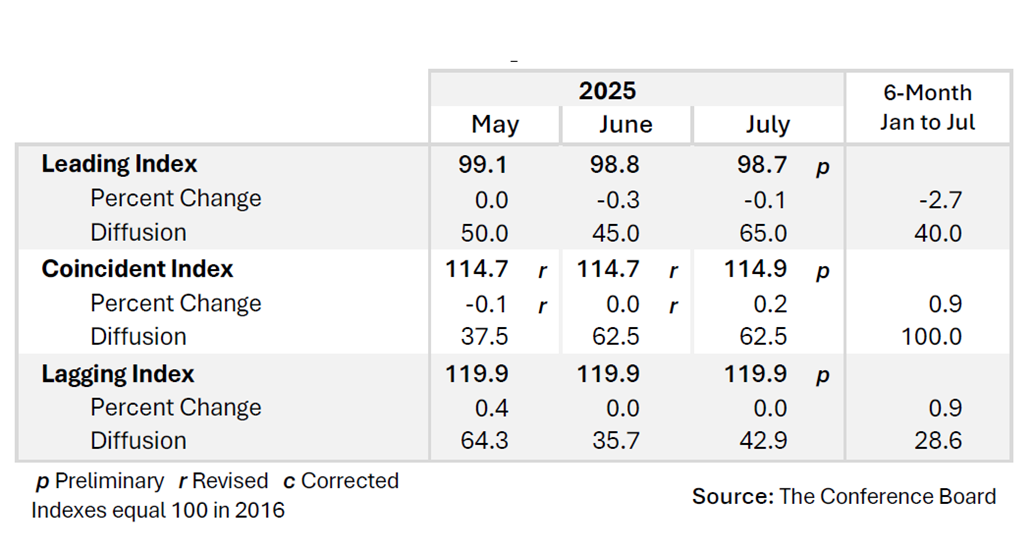
The Conference Board Leading Economic Index® (LEI) for the US inched down by 0.1% in July 2025 to 98.7 (2016=100), after declining by 0.3% in June. The LEI fell by 2.7% over the six months between January and July 2025, a faster rate of decline than its –1.0% contraction over the previous six-month period (July 2024 to January 2025).
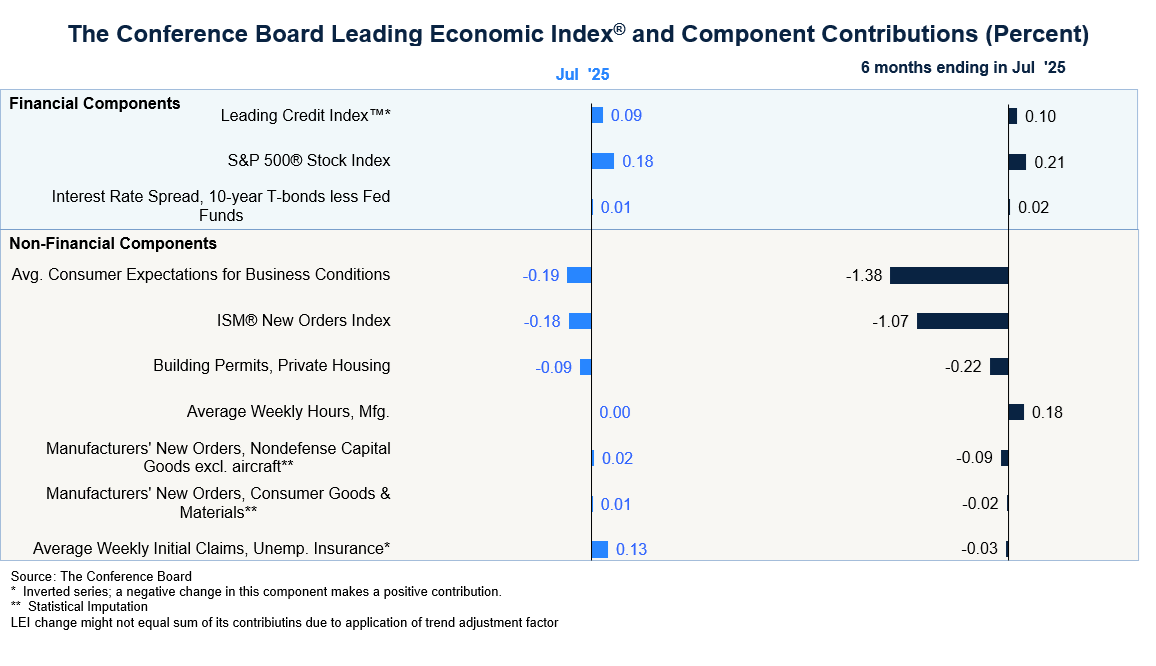
“The leading economic index for the US decreased just slightly in July,” said Justyna Zabinska-La Monica, Senior Manager, Business Cycle Indicators, at The Conference Board. “Pessimistic consumer expectations for business conditions and weak new orders continued to weigh down the index. Meanwhile, stock prices remained a key positive support of the LEI. Initial claims for unemployment insurance were much lower in July than in June and were the second most positive component of the LEI, after contributing negatively to the index over the previous three months. While the LEI’s six-month growth rate remains negative, it improved slighlty in July—but not enough to avoid triggering the recession signal again. Despite that, The Conference Board does not currently project a recession, though we do expect the economy to weaken in H2 2025, as the negative impacts from tariffs become more visible. Overall, real GDP is projected to grow by 1.6% year-over-year in 2025, before slowing in 2026 to 1.3%.”
The Conference Board Coincident Economic Index® (CEI) for the US rose by 0.2% in July 2025 to 114.9 (2016=100), no change in June (a downward revision from an initially reported increase of 0.3%). The CEI rose by 0.9% between January and July 2025, up from 0.6% over the previous six months. The CEI’s four component indicators—payroll employment, personal income less transfer payments, manufacturing and trade sales, and industrial production—are included among the data used to determine recessions in the US. All components of the coincident index except industrial production improved in July.
The Conference Board Lagging Economic Index® (LAG) for the US remained unchanged at 119.9 (2016=100) in both June and July 2025. The LAG grew by 0.9% in the six months between January and July 2025—more than reversing its –0.1% decline over the previous six months.
The LEI continued to inch down in July
Strength among all financial components—and intial claims for unemployment insurance—was not enough to offset negative impacts from consumer confidence and new orders
The LEI’s negative growth rate and low diffusion index over the past six months triggered the recession signal again in July
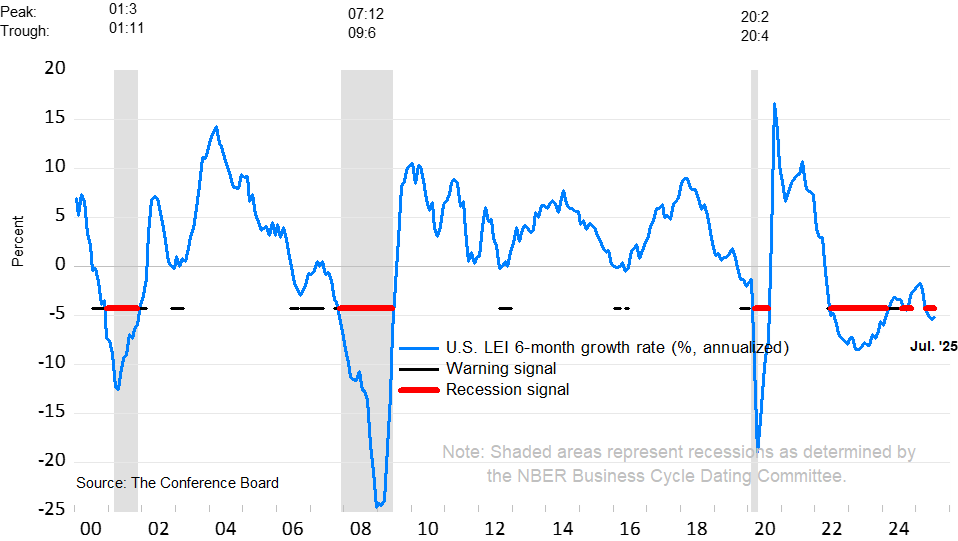
NOTE: The chart illustrates the so-called 3Ds—duration, depth, and diffusion—for interpreting a downward movement in the LEI. Duration refers to how long the decline has lasted. Depth denotes the size of decline. Duration and depth are measured by the rate of change of the index over the most recent six months at an annualized rate. Diffusion is a measure of how widespread the decline is among the LEI’s component indicators—on a scale of 0 to 100, a diffusion index reading below 50 indicates most components are weakening.
The 3Ds rule signals an impending recession when: 1) the six-month diffusion index lies at or below 50, shown by the black warning signal lines in the chart; and 2) the LEI’s six-month growth rate (annualized) falls below the threshold of −4.1%. The red recession signal lines indicate months when both criteria are met simultaneously—and thus that a recession is likely imminent or underway.
Summary Table of Composite Economic Indexes
About The Conference Board Leading Economic Index® (LEI) and Coincident Economic Index® (CEI) for the US
The composite economic indexes are key elements in an analytic system designed to signal peaks and troughs in the business cycle. Comprised of multiple independent indicators, the indexes are constructed to summarize and reveal common turning points in the economy in a clearer and more convincing manner than any individual component.
The CEI reflects current economic conditions and is highly correlated with real GDP. The LEI is a predictive tool that anticipates—or “leads”—turning points in the business cycle by around seven months.
The ten components of the Leading Economic Index® for the US are:
- Average weekly hours in manufacturing
- Average weekly initial claims for unemployment insurance
- Manufacturers’ new orders for consumer goods and materials
- ISM® Index of New Orders
- Manufacturers’ new orders for nondefense capital goods excluding aircraft orders
- Building permits for new private housing units
- S&P 500® Index of Stock Prices
- Leading Credit Index™
- Interest rate spread (10-year Treasury bonds less federal funds rate)
- Average consumer expectations for business conditions
The four components of the Coincident Economic Index® for the US are:
- Payroll employment
- Personal income less transfer payments
- Manufacturing and trade sales
- Industrial production
To access data, please visit: https://data-central.conference-board.org/
About The Conference Board
The Conference Board is the member-driven think tank that delivers Trusted Insights for What’s Ahead®. Founded in 1916, we are a non-partisan, not-for-profit entity holding 501 (c) (3) tax-exempt status in the United States. ConferenceBoard.org